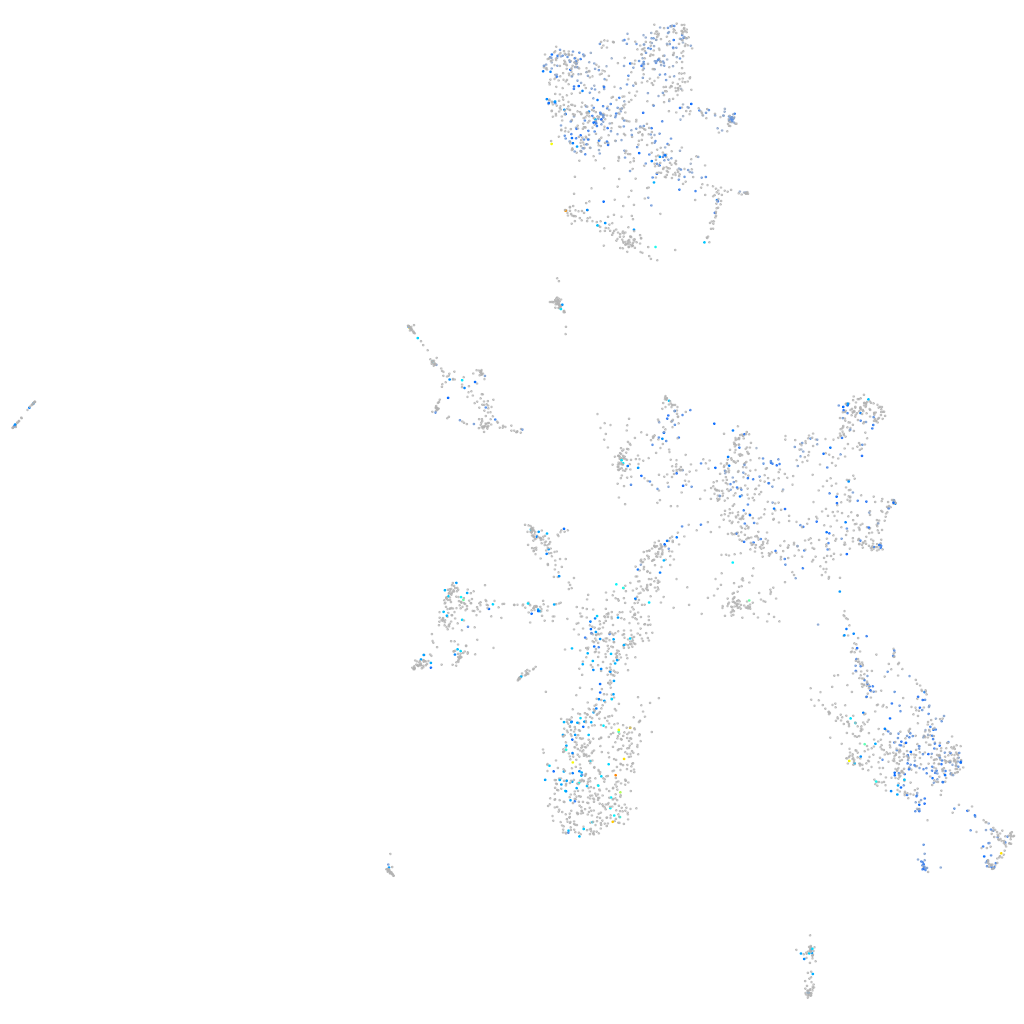
Daniocell
taz (taste / olfactory)
tafazzin
ZFIN
Gene expression UMAP
Display:
Expression
Stage
Other cell groups
all cells
blastomeres
PGCs
endoderm
axial mesoderm
muscle
mural cells /
non-skeletal muscle
mesenchyme
hematopoietic /
vasculature
pronephros
neural
spinal cord / glia
eye
taste / olfactory
otic / lateral line
epidermis
periderm
fin
ionocytes / mucous
pigment cells
Expression by stage/cluster
Correlated gene expression
Positive correlation
Negative correlation
Gene
r
Gene
r
pimr197.1
0.143
rplp1
-0.075
arpc1a
0.112
rpl38
-0.072
ccni
0.110
rps29
-0.071
atp6v1c2
0.109
rps12
-0.068
si:dkey-30g5.1
0.109
hmgn6
-0.061
RF00322
0.107
rpl13a
-0.059
msi2b
0.106
zgc:114188
-0.056
mark1
0.105
rpl14
-0.055
si:dkey-88n24.11
0.104
si:ch73-281n10.2
-0.054
CU694532.1
0.104
rpl29
-0.053
zmp:0000001006
0.101
rps21
-0.053
lingo2b
0.100
rpl31
-0.053
LOC101883810
0.099
si:ch211-222l21.1
-0.053
si:ch211-249h16.8
0.099
rpl34
-0.051
XLOC-036254
0.098
rpl37
-0.051
tspan35
0.098
hbae3
-0.050
RASA2
0.097
hmga1a
-0.050
CABZ01084566.1
0.096
neurod1
-0.049
gclm
0.096
rps19
-0.049
vsig8a
0.096
rps9
-0.048
nptnb
0.096
XLOC-003692
-0.048
anxa5b
0.096
faua
-0.047
ccl39.3
0.095
bzw1a
-0.047
zgc:153913
0.095
zgc:165555.3
-0.046
rbm27
0.094
ckap2l
-0.046
tm9sf2
0.094
zgc:174862
-0.045
tmem59
0.093
spc25
-0.044
osbpl2b
0.093
si:dkey-151g10.6
-0.044
igfals
0.093
dla
-0.044
si:ch1073-443f11.2
0.093
ebf2
-0.043
echdc2
0.093
prim1
-0.043
kifap3a
0.092
ssrp1a
-0.043
wu:fu71h07
0.092
chaf1a
-0.043
sdcbp2
0.092
rps18
-0.043
kif5bb
0.092
LOC100537384
-0.043