Daniocell
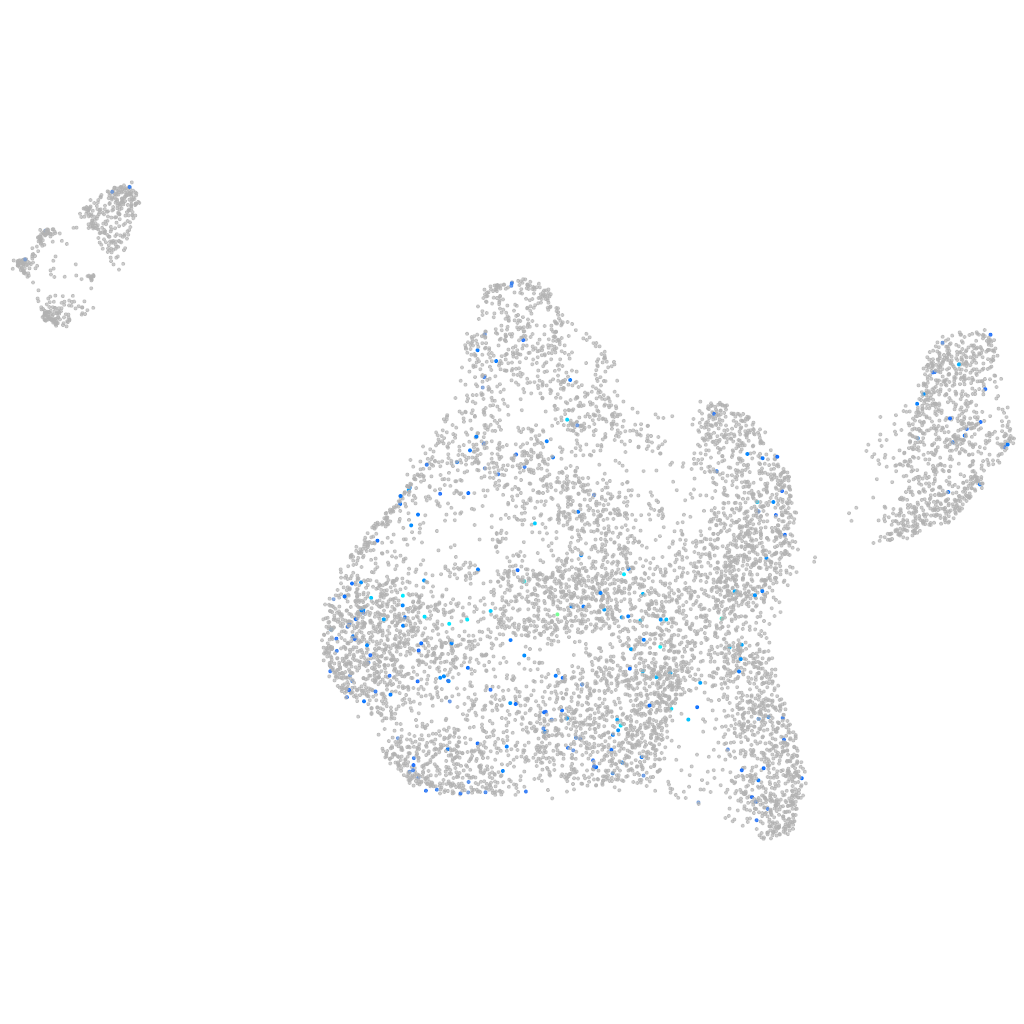
taz (blastomeres)
tafazzin
ZFIN
Gene expression UMAP
Display:
Expression
Stage
Other cell groups
all cells
blastomeres
PGCs
endoderm
axial mesoderm
muscle
mural cells /
non-skeletal muscle
mesenchyme
hematopoietic /
vasculature
pronephros
neural
spinal cord / glia
eye
taste / olfactory
otic / lateral line
epidermis
periderm
fin
ionocytes / mucous
pigment cells
Expression by stage/cluster
Correlated gene expression
Positive correlation
Negative correlation
Gene
r
Gene
r
XLOC-009918
0.140
sec61b
-0.047
cacna1sa
0.126
zgc:100951
-0.044
pglyrp5
0.118
si:dkey-261j4.5
-0.044
jag2a
0.113
epcam
-0.042
LOC103910383
0.102
aif1l
-0.042
CABZ01072487.2
0.100
spink2.1
-0.041
CR628365.1
0.100
nanog
-0.041
BX842701.1
0.094
gdf3
-0.040
bfsp2
0.092
mia3
-0.040
dnah12
0.086
acp5a
-0.040
si:dkeyp-80d11.10
0.086
gtf2a1
-0.039
sik1
0.083
mcmbp
-0.039
LOC110440040
0.083
thoc2
-0.039
itgb3a
0.082
zgc:56676
-0.039
mfrp
0.080
gkap1
-0.039
slc5a7a
0.079
gmfb
-0.037
CABZ01084501.3
0.079
rbpms2b
-0.037
crygm2d20
0.079
stim1a
-0.037
CT990618.1
0.078
bzw1b
-0.037
CR396584.1
0.078
f11r.1
-0.036
LOC101885530
0.077
blf
-0.036
LOC101886896
0.075
mid1ip1l
-0.036
XLOC-020086
0.075
btg4
-0.035
LOC103911530
0.074
npc2
-0.035
CABZ01102201.1
0.073
gigyf2
-0.035
wisp3
0.072
uqcc1
-0.035
si:ch211-14k19.8
0.071
gpx8
-0.034
si:ch211-66i15.4
0.071
mtdha
-0.034
mir219-1
0.070
sdc4
-0.034
LOC110439813
0.069
h1m
-0.033
CR792453.2
0.069
ilk
-0.033
si:busm1-52i16.2
0.069
ncbp3
-0.033
scpp9
0.069
ppdpfb
-0.033
csf3r
0.068
tspan36
-0.032
si:ch73-28h20.1
0.067
gpkow
-0.032