Daniocell
st3gal3a (fin)
"ST3 beta-galactoside alpha-2,3-sialyltransferase 3a"
ZFIN
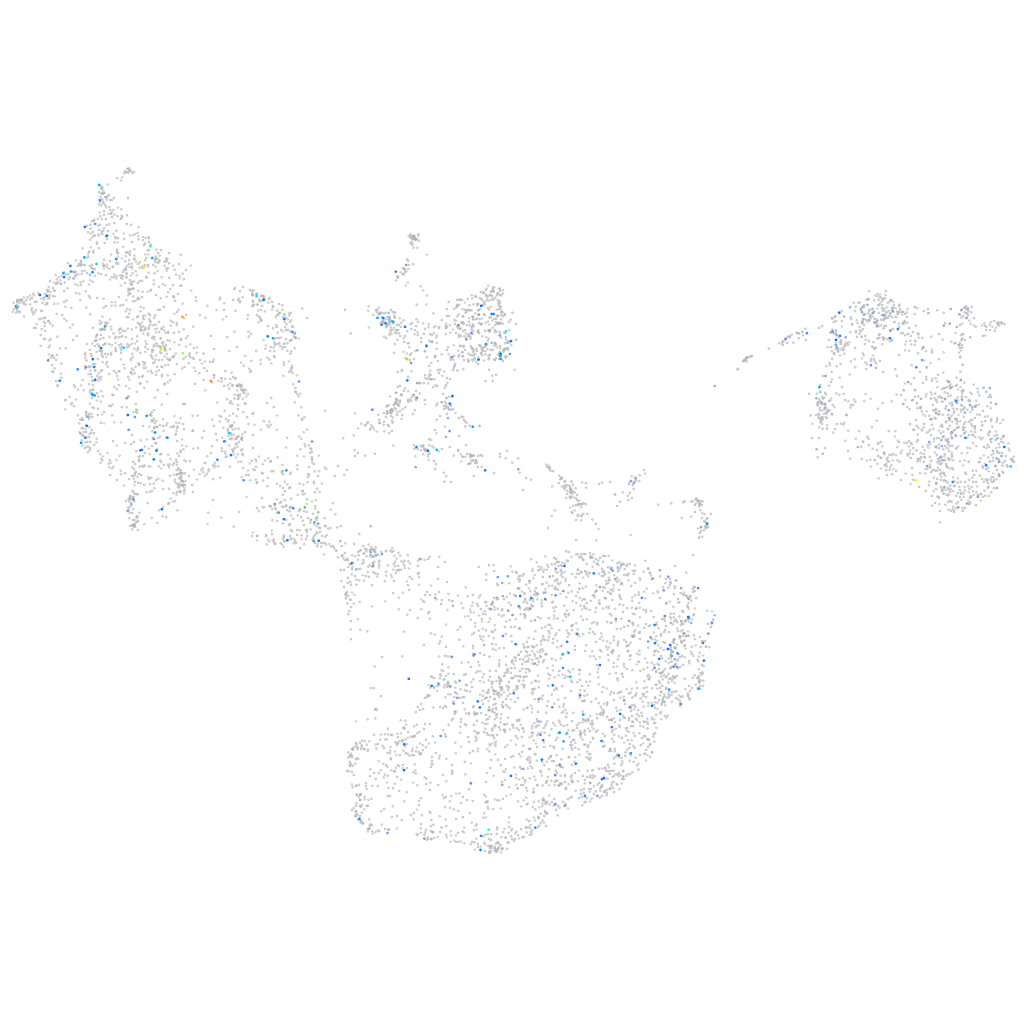
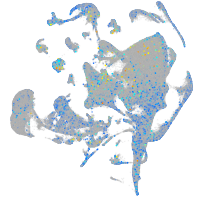
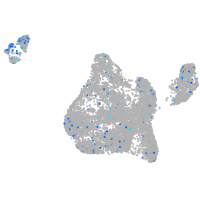
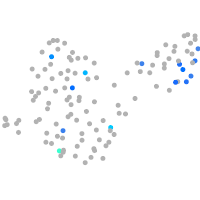
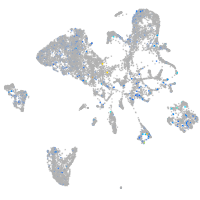
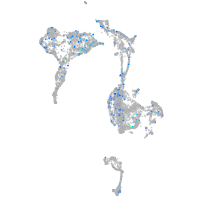
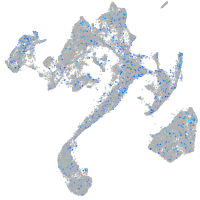
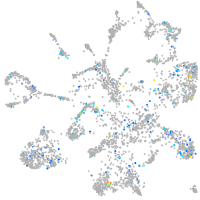
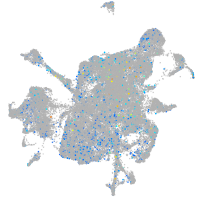
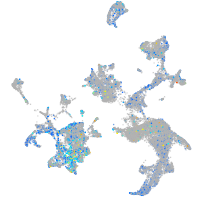
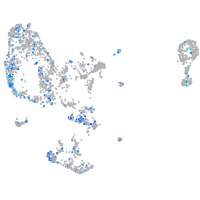
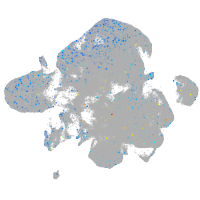
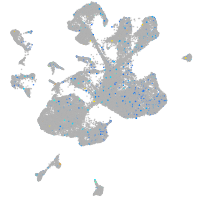
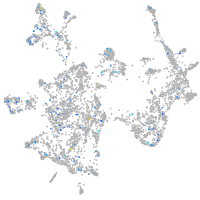
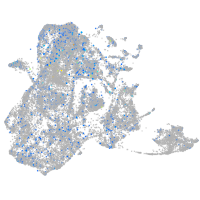
Gene expression UMAP
Display:
Expression
Stage
Other cell groups
all cells
blastomeres
PGCs
endoderm
axial mesoderm
muscle
mural cells /
non-skeletal muscle
mesenchyme
hematopoietic /
vasculature
pronephros
neural
spinal cord / glia
eye
taste / olfactory
otic / lateral line
epidermis
periderm
fin
ionocytes / mucous
pigment cells
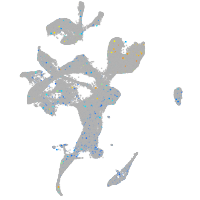
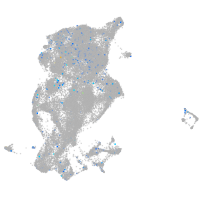
Expression by stage/cluster
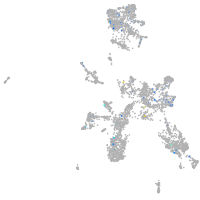
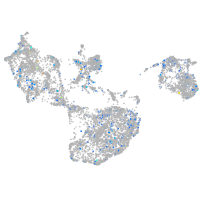
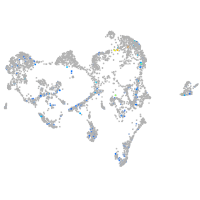
Correlated gene expression
Positive correlation
Negative correlation
Gene
r
Gene
r
LOC103911727
0.174
alox12
-0.040
fcer1g
0.154
itih5
-0.037
LOC100330746.1
0.133
frem1a
-0.032
LOC110439347
0.130
kazald2
-0.030
znf980
0.127
cpa6
-0.029
gpsm1b
0.125
srpx2
-0.029
drd1b
0.124
zgc:174938
-0.029
elnb
0.121
sp6
-0.028
scara5
0.114
rasgef1ba
-0.028
prkg2
0.114
si:ch211-194g2.4
-0.028
opn9
0.114
ptmaa
-0.027
slitrk5b
0.111
col14a1a
-0.027
plekhd1
0.110
mylpfa
-0.027
CABZ01079480.1
0.109
pdlim5b
-0.027
si:dkey-269p2.1
0.109
b3gat3
-0.027
LOC103911188
0.109
LOC110439627
-0.027
slc4a5a
0.102
fstl1a
-0.027
CR450727.1
0.101
tmem54a
-0.027
hyal2a
0.100
myoc
-0.026
btbd17b
0.099
ttn.1
-0.026
BX323801.1
0.098
plekhh1
-0.026
BX682557.1
0.097
si:ch211-284e13.6
-0.026
si:ch211-153l6.6
0.092
XLOC-021234
-0.026
glra2
0.091
frem2a
-0.026
chrnb2b
0.091
apoc1
-0.025
hnrnpdl
0.091
akap9
-0.025
si:cabz01069015.1
0.090
slc6a17
-0.025
si:dkey-96g2.1
0.090
optc
-0.025
stag3
0.090
patl1
-0.025
nt5c1aa
0.089
olah
-0.025
arl15b
0.088
dkk1b
-0.025
nmu
0.087
mllt3
-0.024
si:dkey-57h18.1
0.086
hmga1a
-0.024
hrh2b
0.085
si:ch211-267e7.3
-0.024
tph2
0.084
FP017215.1
-0.024