Daniocell
srgap1a (pigment cells)
SLIT-ROBO Rho GTPase activating protein 1a
ZFIN
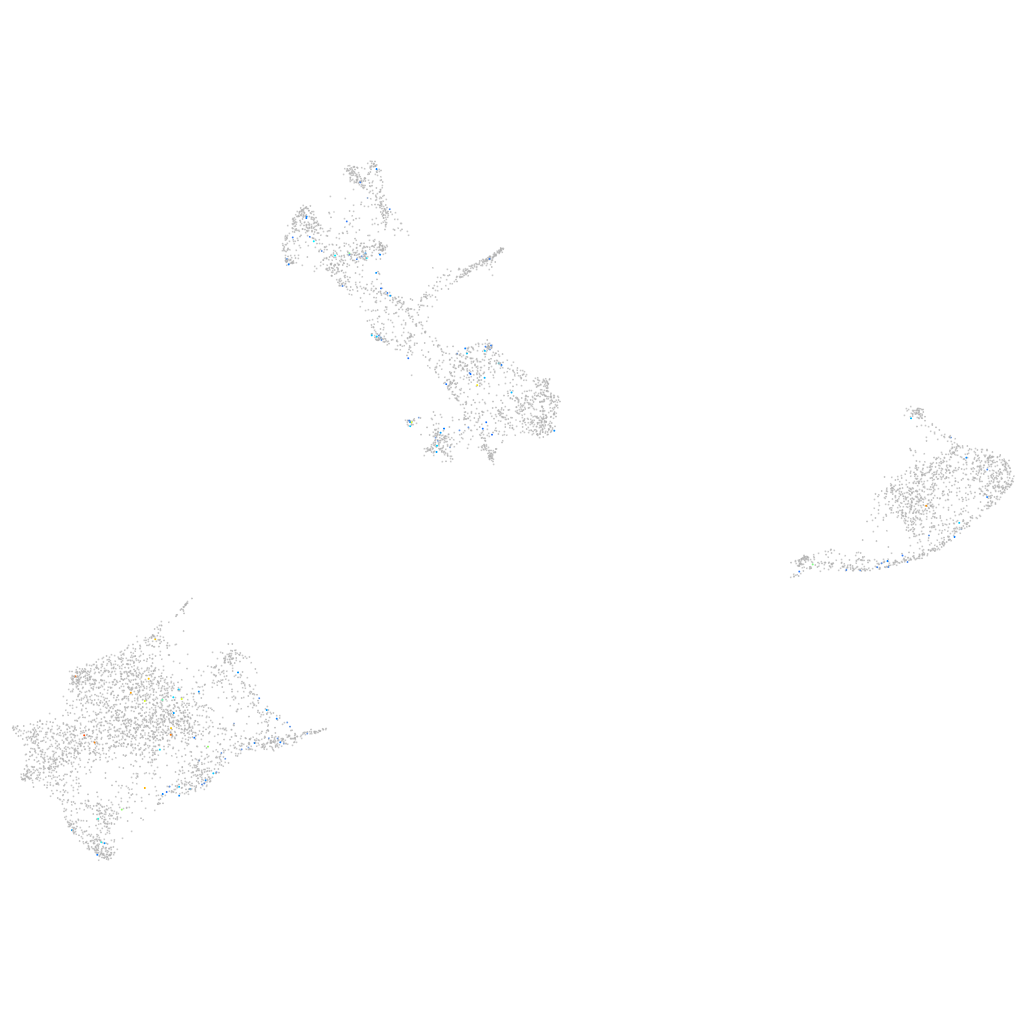
Gene expression UMAP
Display:
Expression
Stage
Other cell groups
all cells
blastomeres
PGCs
endoderm
axial mesoderm
muscle
mural cells /
non-skeletal muscle
mesenchyme
hematopoietic /
vasculature
pronephros
neural
spinal cord / glia
eye
taste / olfactory
otic / lateral line
epidermis
periderm
fin
ionocytes / mucous
pigment cells
Expression by stage/cluster
Correlated gene expression
Positive correlation
Negative correlation
Gene
r
Gene
r
pard6ga
0.151
rpl36a
-0.040
olfm3b
0.141
actc1b
-0.036
BX901923.1
0.141
tpma
-0.033
CR376741.4
0.140
rpl38
-0.033
si:ch211-87j1.4
0.140
tnni2a.4
-0.033
cytip
0.133
icn
-0.030
colec11
0.132
nme2b.2
-0.029
bmf1
0.130
rps15
-0.028
LOC110440109
0.125
si:dkey-151g10.6
-0.027
XLOC-015424
0.124
rpl10a
-0.027
prf1.9
0.117
CELA1 (1 of many)
-0.027
malt2
0.116
rps23
-0.027
CABZ01117840.1
0.115
rps21
-0.026
si:dkey-246e1.3
0.114
icn2
-0.026
cts12
0.113
rps17
-0.026
znf1130
0.112
pmela
-0.026
tlr18
0.110
pvalb1
-0.025
rln3b
0.109
s100a10b
-0.025
ptges
0.107
rpl11
-0.025
si:dkey-193n17.9
0.106
myl1
-0.024
LOC110438973
0.105
mylz3
-0.024
LOC103909565
0.105
tyrp1b
-0.024
FP017295.1
0.104
prss59.2
-0.024
mir223
0.104
oca2
-0.024
CABZ01072950.1
0.103
slc22a2
-0.023
CU571398.1
0.103
tyrp1a
-0.023
CABZ01086293.1
0.100
s100w
-0.023
dnase1l1l
0.099
cyt1
-0.022
mespba
0.099
actr10
-0.022
zgc:173915
0.099
slc6a15
-0.022
tmx2a
0.098
zgc:91968
-0.022
LOC110439829
0.098
myhz1.1
-0.022
AL590134.1
0.097
eef1a1l1
-0.021
LOC108183555
0.096
si:ch211-156j16.1
-0.021
pgfb
0.094
ak1
-0.021