Daniocell
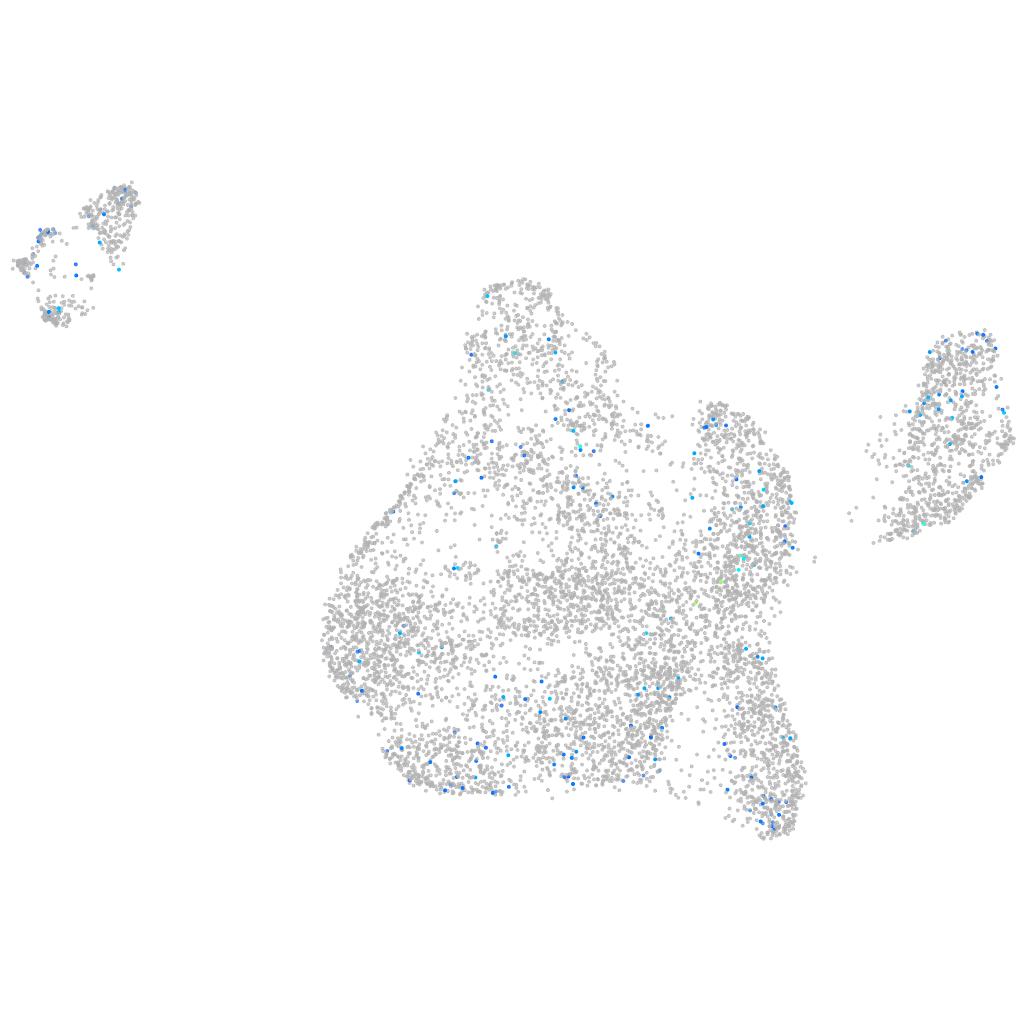
srgap1a (blastomeres)
SLIT-ROBO Rho GTPase activating protein 1a
ZFIN
Gene expression UMAP
Display:
Expression
Stage
Other cell groups
all cells
blastomeres
PGCs
endoderm
axial mesoderm
muscle
mural cells /
non-skeletal muscle
mesenchyme
hematopoietic /
vasculature
pronephros
neural
spinal cord / glia
eye
taste / olfactory
otic / lateral line
epidermis
periderm
fin
ionocytes / mucous
pigment cells
Expression by stage/cluster
Correlated gene expression
Positive correlation
Negative correlation
Gene
r
Gene
r
LOC108190601
0.127
si:ch73-1a9.3
-0.062
AL929276.1
0.118
rplp0
-0.061
apoa4b.1
0.111
dynll1
-0.060
si:dkey-78l4.13
0.111
rps6
-0.058
CR555293.1
0.104
hspb1
-0.057
slc43a3b
0.101
eef1a1l1
-0.057
mir430b-6
0.100
hmga1a
-0.054
arhgef9a
0.099
si:ch211-152c2.3
-0.053
LOC103910891
0.098
hnrnpa0b
-0.050
nlrc7
0.097
rps12
-0.049
pimr186
0.097
marcksl1b
-0.048
LOC103909575
0.095
npm1a
-0.047
BX545917.5
0.094
cirbpb
-0.046
LOC108191721
0.089
si:ch211-222l21.1
-0.046
slc19a3a
0.089
hmgn6
-0.046
BX901974.2
0.088
rpsa
-0.045
LO018605.2
0.088
tuba8l4
-0.045
myo1ea
0.087
rpl11
-0.044
agap2
0.086
add3b
-0.044
zgc:172282
0.085
tp53inp2
-0.043
LOC101882691
0.084
mcm3
-0.043
XLOC-034525
0.084
rpl13
-0.043
si:dkey-220o5.5
0.083
aldob
-0.042
slc26a3.1
0.082
rpl32
-0.042
noxo1a
0.082
hmgb2a
-0.042
gjd1a
0.081
snrpd1
-0.041
LOC110439419
0.079
apoeb
-0.041
XLOC-042341
0.078
rps19
-0.040
hs6st3b
0.077
polr3gla
-0.040
smcr8b
0.077
khdrbs1a
-0.040
si:ch211-214k5.3
0.076
hsp90ab1
-0.040
si:ch1073-185p12.2
0.076
h2afvb
-0.039
FO905052.1
0.076
ptmab
-0.039
oacyl
0.074
rpl7
-0.039
si:ch73-1f23.1
0.074
rpl35
-0.039