Daniocell
sptbn2 (blastomeres)
"spectrin, beta, non-erythrocytic 2"
ZFIN
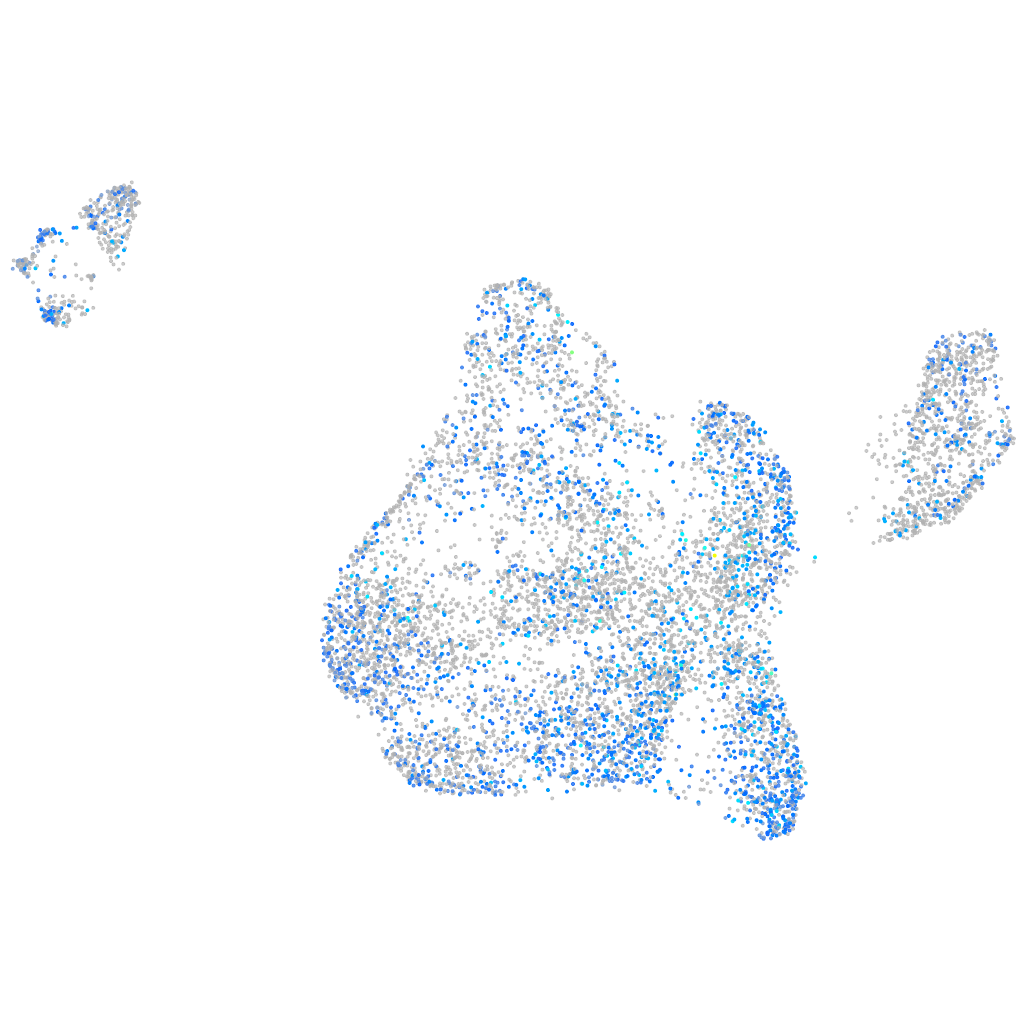
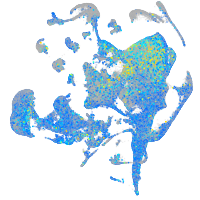
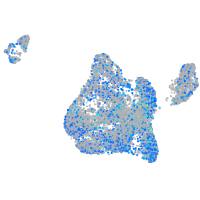
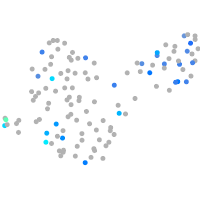
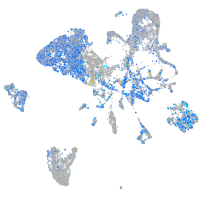
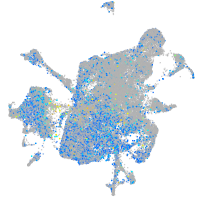
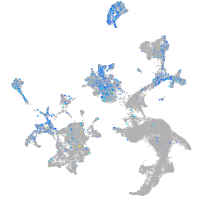
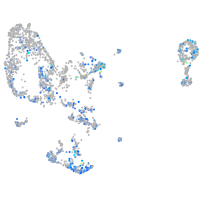
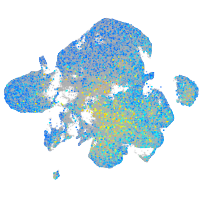
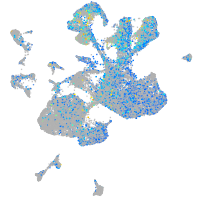
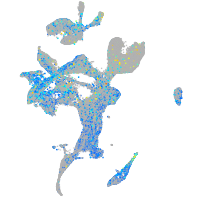
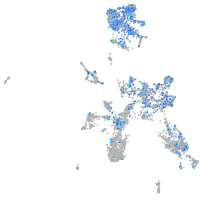
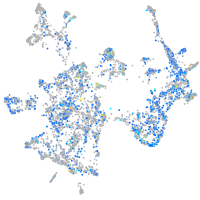
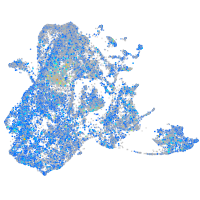
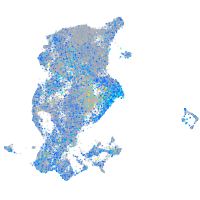
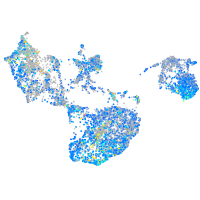
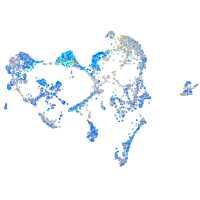
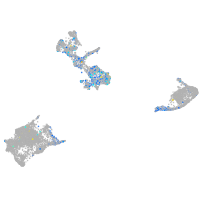
Gene expression UMAP
Display:
Expression
Stage
Other cell groups
all cells
blastomeres
PGCs
endoderm
axial mesoderm
muscle
mural cells /
non-skeletal muscle
mesenchyme
hematopoietic /
vasculature
pronephros
neural
spinal cord / glia
eye
taste / olfactory
otic / lateral line
epidermis
periderm
fin
ionocytes / mucous
pigment cells
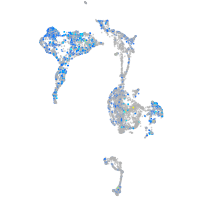
Expression by stage/cluster
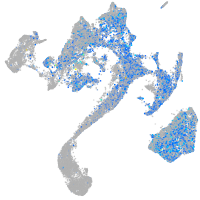
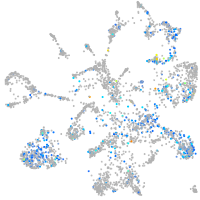
Correlated gene expression
Positive correlation
Negative correlation
Gene
r
Gene
r
akap12b
0.161
h3f3d
-0.076
mki67
0.131
cth1
-0.067
nucks1a
0.126
ucp2
-0.064
si:dkey-108k21.10
0.117
spink2.1
-0.062
tprb
0.117
cldnd
-0.062
ncl
0.117
gstp1
-0.057
si:ch211-113a14.18
0.111
nanog
-0.056
si:dkey-261m9.12
0.110
si:dkey-261j4.3
-0.053
csde1
0.109
oaz1a
-0.053
zgc:110425
0.104
klhl20
-0.052
hnrnpub
0.104
ccna2
-0.051
cenpf
0.103
hsd17b12a
-0.051
nolc1
0.102
tmem176l.1
-0.050
CABZ01044053.1
0.102
noto
-0.050
top2a
0.100
uba3
-0.050
ppm1g
0.100
gale
-0.050
atrx
0.098
fthl27
-0.050
hmgb2a
0.097
vgll4l
-0.049
znf800a
0.096
rbm38
-0.049
khdrbs1b
0.096
cdc34a
-0.048
zgc:153405
0.096
tmem192
-0.048
smc2
0.092
snrpc
-0.048
si:dkey-250d21.1
0.092
trappc6b
-0.048
si:ch1073-153i20.5
0.092
rbm4.3
-0.046
si:ch1073-153i20.4
0.091
gtf2a1
-0.045
si:ch211-113a14.24
0.089
tent4b
-0.045
ctcf
0.089
mid1ip1l
-0.045
zgc:110216
0.088
tent5c
-0.045
si:dkey-23a13.17
0.087
pabpn1l
-0.045
mgaa
0.086
mt-cyb
-0.044
sptbn1
0.084
RIC3
-0.044
eif4g1a
0.084
pi4k2b
-0.044
pip5k1aa
0.084
dctpp1
-0.044
tpra
0.082
desi2
-0.044
si:ch211-222l21.1
0.082
h2afva
-0.044