Daniocell
sned1 (glial cells / spinal cord)
"sushi, nidogen and EGF-like domains 1"
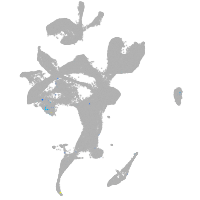
ZFIN
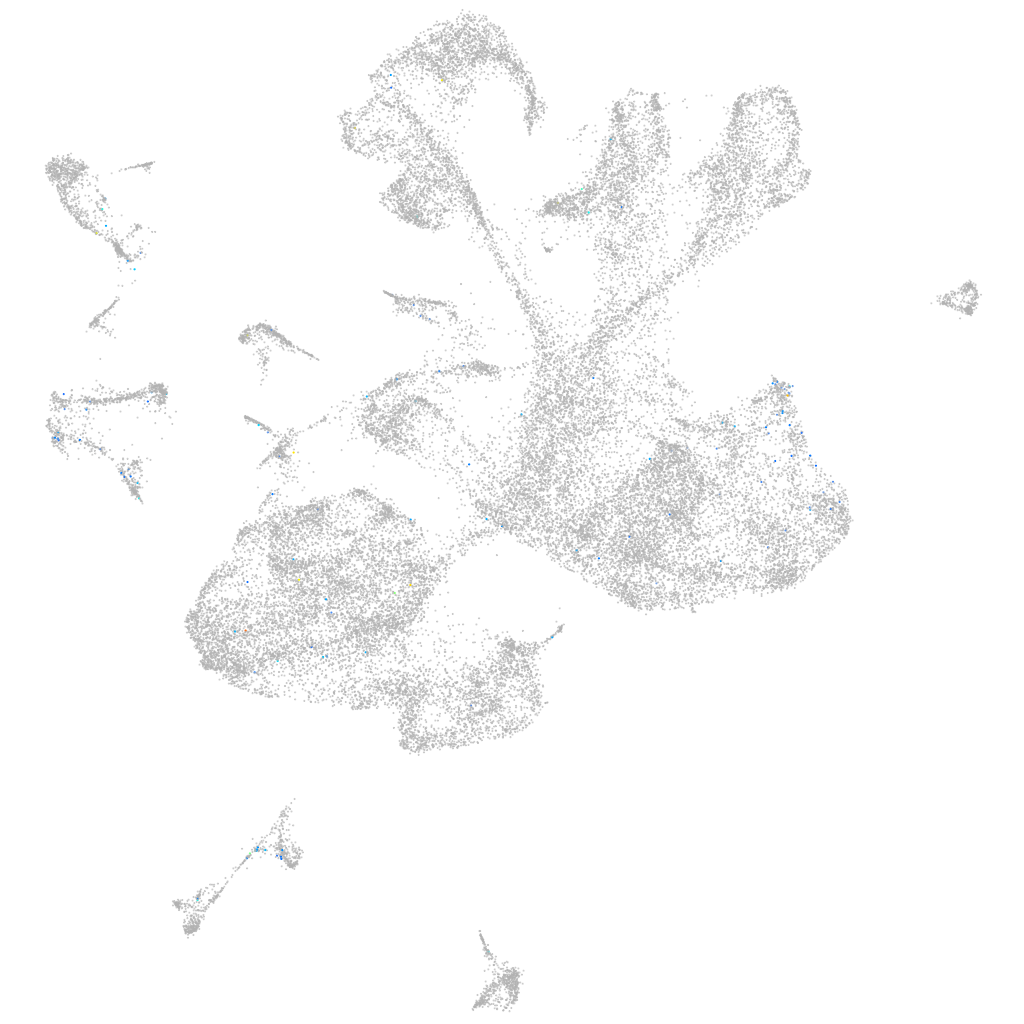
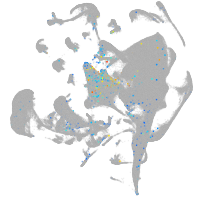
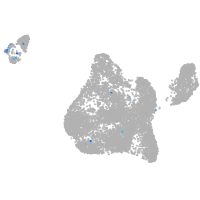
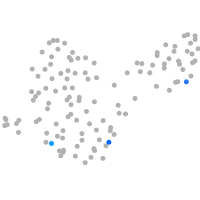
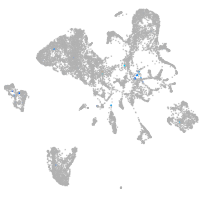
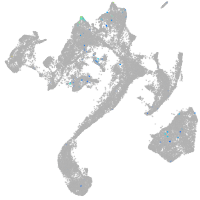
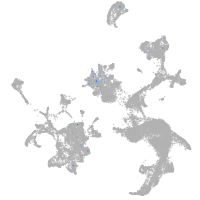
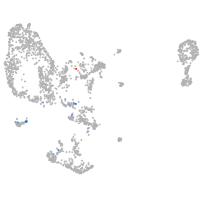
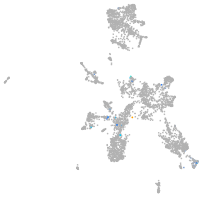
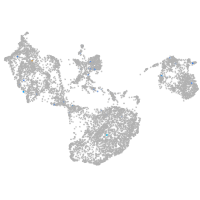
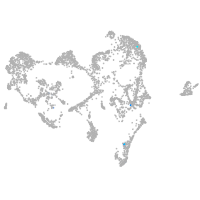
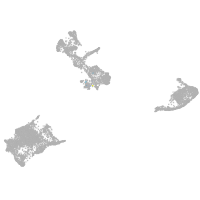
Gene expression UMAP
Display:
Expression
Stage
Other cell groups
all cells
blastomeres
PGCs
endoderm
axial mesoderm
muscle
mural cells /
non-skeletal muscle
mesenchyme
hematopoietic /
vasculature
pronephros
neural
spinal cord / glia
eye
taste / olfactory
otic / lateral line
epidermis
periderm
fin
ionocytes / mucous
pigment cells
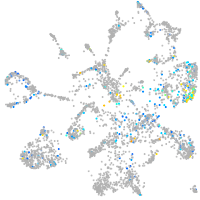
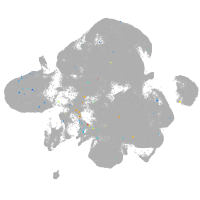
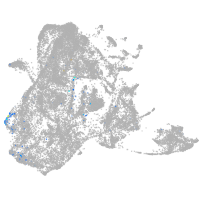
Expression by stage/cluster
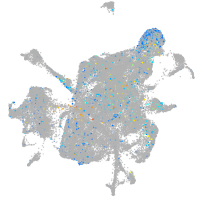
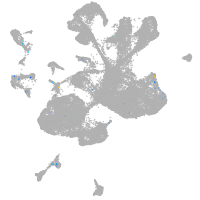
Correlated gene expression
Positive correlation
Negative correlation
Gene
r
Gene
r
LOC103908612
0.143
fabp3
-0.034
BX897685.1
0.134
nova2
-0.030
si:ch1073-441p17.1
0.100
hmgb3a
-0.027
LOC108190067
0.093
h3f3a
-0.026
XLOC-043568
0.089
hmgb1b
-0.026
si:ch211-142d6.2
0.087
si:ch211-288g17.3
-0.023
LOC100002472
0.086
si:ch211-137a8.4
-0.023
LOC103911034
0.083
myt1a
-0.022
NAT16
0.083
ptmab
-0.022
ticrr
0.083
si:ch211-57n23.4
-0.022
si:ch211-183d5.2
0.081
hmga1a
-0.022
rnasel2
0.081
si:dkey-276j7.1
-0.022
LOC110439893
0.081
ewsr1a
-0.022
si:dkey-6a5.3
0.080
hmgn6
-0.021
si:dkeyp-5g9.1
0.077
smarce1
-0.021
LOC101886630
0.077
pbx4
-0.021
cyp19a1a
0.076
snrpd1
-0.021
si:dkey-207b20.2
0.071
khdrbs1a
-0.020
BX640522.2
0.071
tp53inp2
-0.020
hnf4a
0.069
si:ch73-21g5.7
-0.020
LOC103911301
0.067
tmeff1b
-0.020
RF01233
0.064
hmgn3
-0.019
kcnj12a
0.064
her4.2
-0.019
CT573787.1
0.062
tubb2b
-0.019
CU019646.1
0.062
elavl3
-0.019
si:dkey-28d5.5
0.062
abhd6a
-0.019
abcc6b.1
0.061
sb:cb81
-0.019
si:busm1-57f23.1
0.061
hnrnpa0b
-0.019
agtr1b
0.060
XLOC-003689
-0.019
si:dkey-199f5.3
0.059
sox11b
-0.018
BX001026.1
0.058
dla
-0.018
si:ch211-202p1.5
0.058
hspa8
-0.018
si:dkey-240e12.6
0.055
tmsb
-0.018
XLOC-032119
0.055
si:ch211-222l21.1
-0.018
si:ch211-89o9.4
0.054
pou3f1
-0.018