Daniocell
slitrk2 (endoderm)
"SLIT and NTRK-like family, member 2"
ZFIN
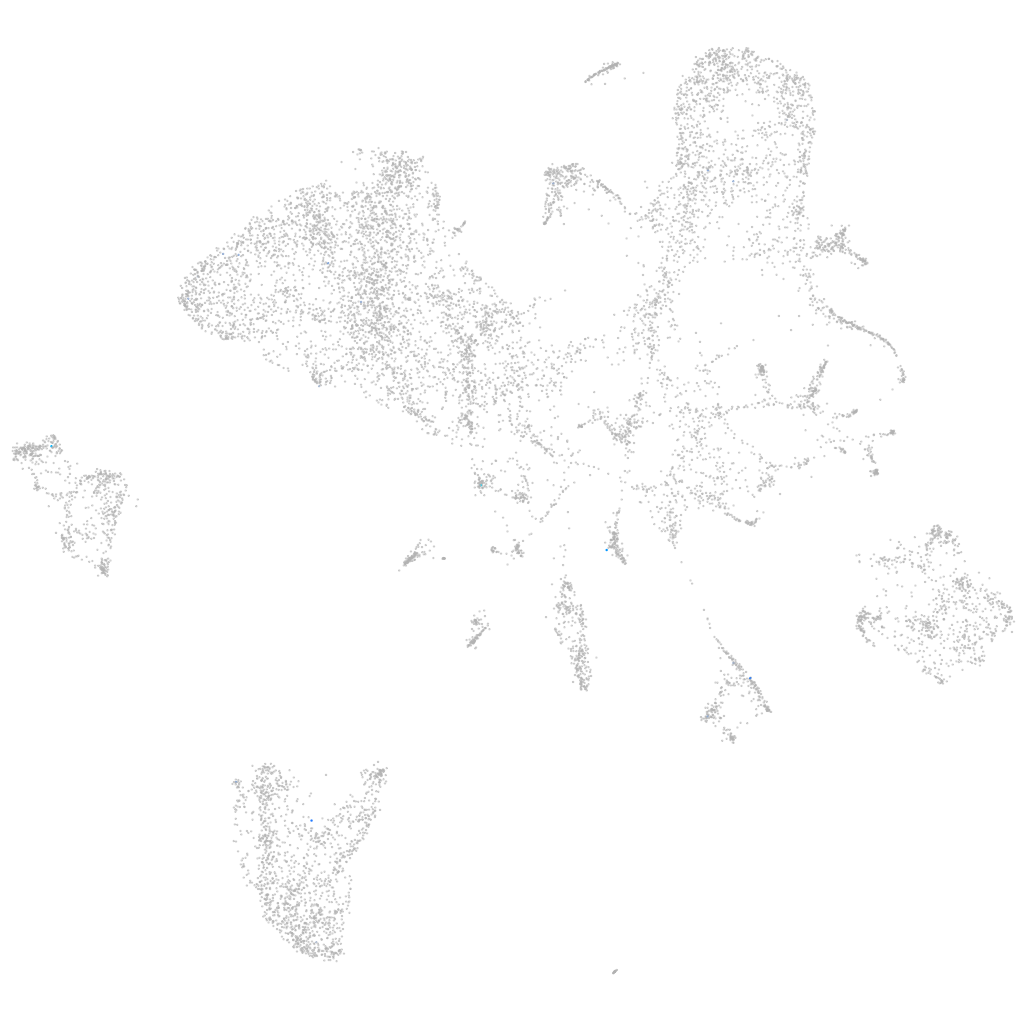
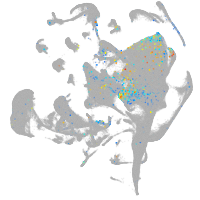
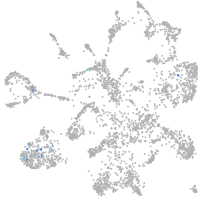
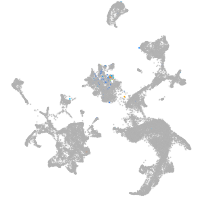
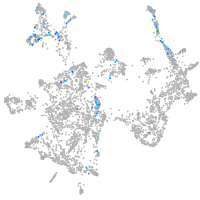
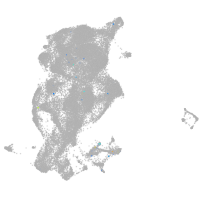
Gene expression UMAP
Display:
Expression
Stage
Other cell groups
all cells
blastomeres
PGCs
endoderm
axial mesoderm
muscle
mural cells /
non-skeletal muscle
mesenchyme
hematopoietic /
vasculature
pronephros
neural
spinal cord / glia
eye
taste / olfactory
otic / lateral line
epidermis
periderm
fin
ionocytes / mucous
pigment cells
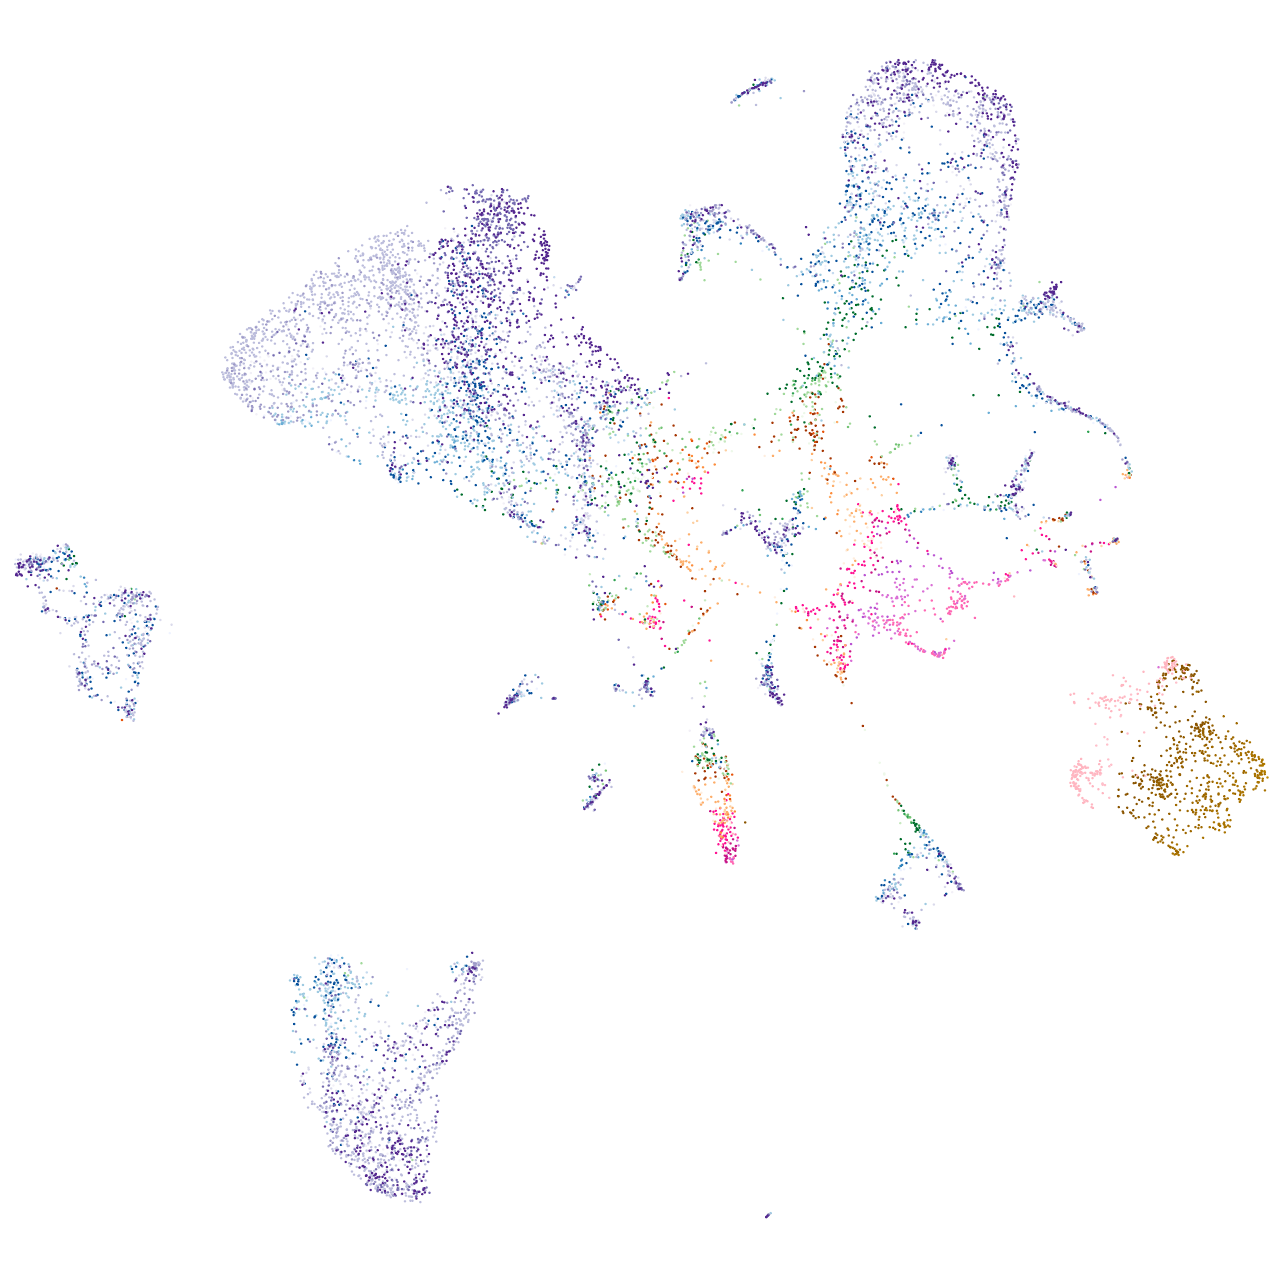
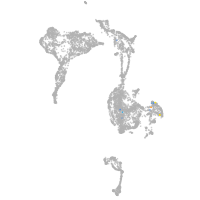
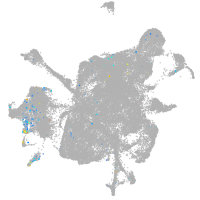
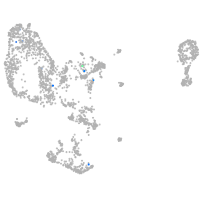
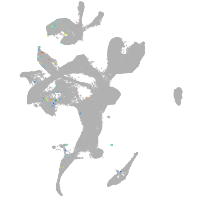
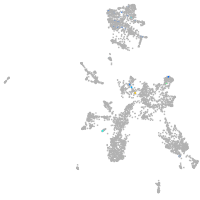
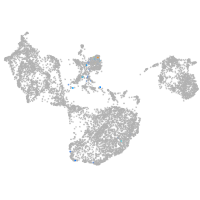
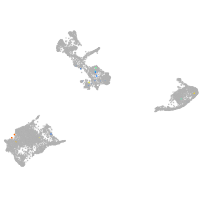
Expression by stage/cluster
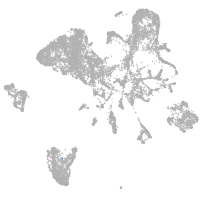
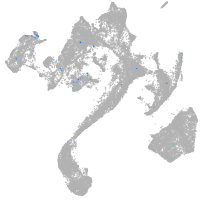
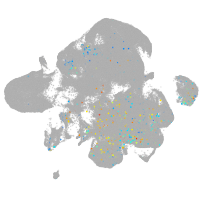
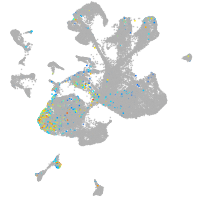
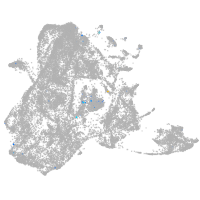
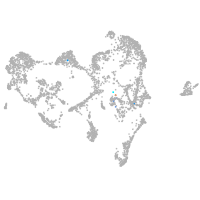
Correlated gene expression
Positive correlation
Negative correlation
Gene
r
Gene
r
fndc4a
0.574
rpl18
-0.019
gabra3
0.496
psma4
-0.016
chrna6
0.362
gamt
-0.016
AL627305.1
0.317
eif4ebp3l
-0.015
rad21b
0.306
phb
-0.014
CABZ01068246.1
0.295
eif4bb
-0.014
si:dkeyp-20g2.3
0.290
usp36
-0.014
si:ch73-380n15.2
0.273
thrap3b
-0.014
LOC110438594
0.268
sars
-0.014
gabrg1
0.266
rsl1d1
-0.014
XLOC-027134
0.256
echs1
-0.013
vtg5
0.254
gstt1a
-0.013
LOC100149700
0.244
mat2aa
-0.013
fgfbp2a
0.239
cox6b2
-0.013
si:ch211-277e21.1
0.238
cdo1
-0.013
spo11
0.226
ybx1
-0.013
XLOC-023752
0.226
nolc1
-0.013
LOC108182865
0.218
XLOC-044191
-0.013
XLOC-034550
0.218
mknk2b
-0.013
XLOC-001482
0.216
dkc1
-0.013
LOC110438093
0.215
bfb
-0.013
cort
0.213
eif2s1a
-0.013
fyba
0.204
si:ch73-308l14.2
-0.013
mgat4c
0.198
tram1
-0.013
LOC110438155
0.196
mthfs
-0.013
ppp1r16b
0.192
ets2
-0.013
rhbdl1
0.186
ahcy
-0.013
LOC100333913
0.186
khdrbs1b
-0.013
adra1d
0.186
med19a
-0.013
LO018380.1
0.182
si:ch1073-314i13.4
-0.013
BX571952.1
0.181
gpx4a
-0.012
gpr22b
0.180
pinx1
-0.012
si:ch211-113a14.17
0.179
tomm70a
-0.012
si:ch211-1e14.1
0.172
pi4k2b
-0.012
PLPP7 (1 of many)
0.170
pum3
-0.012