Daniocell
si:dkeyp-77h1.4 (taste / olfactory)
si:dkeyp-77h1.4
ZFIN
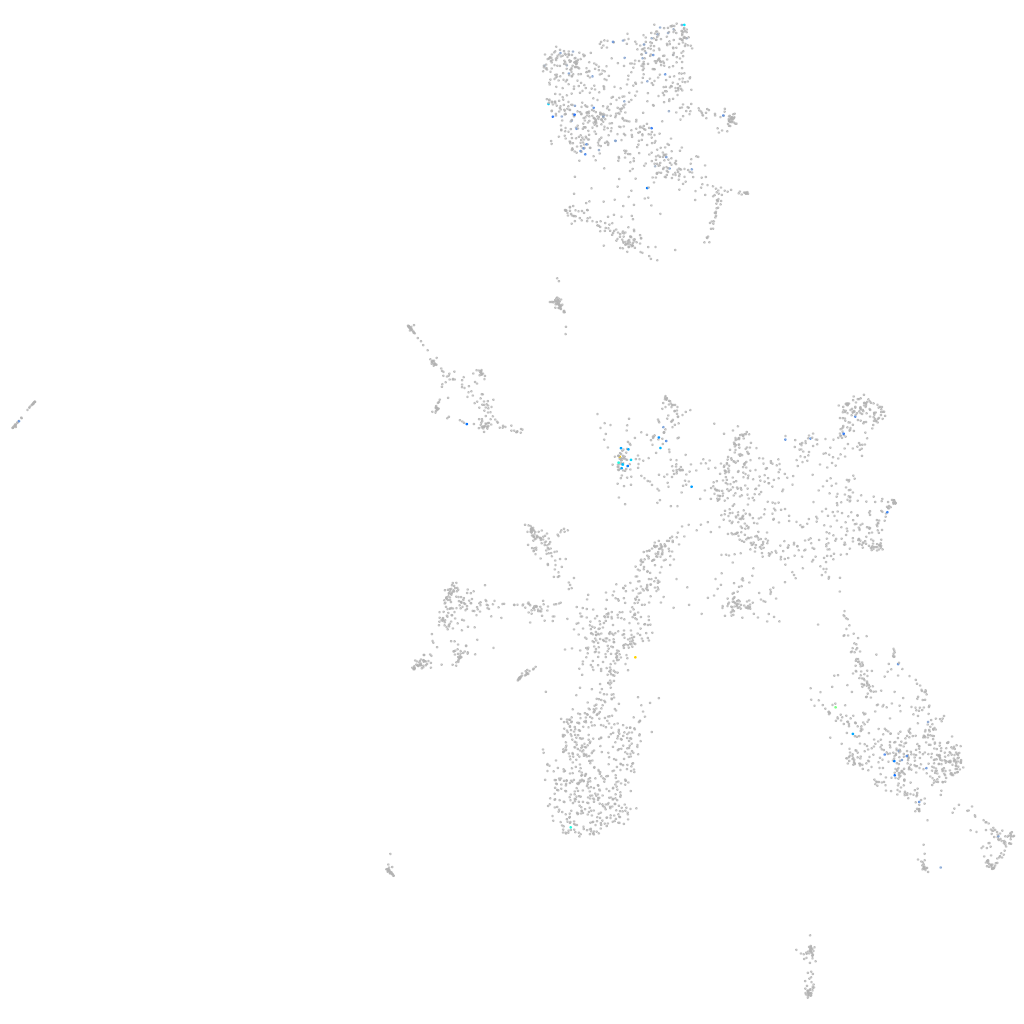
Gene expression UMAP
Display:
Expression
Stage
Other cell groups
all cells
blastomeres
PGCs
endoderm
axial mesoderm
muscle
mural cells /
non-skeletal muscle
mesenchyme
hematopoietic /
vasculature
pronephros
neural
spinal cord / glia
eye
taste / olfactory
otic / lateral line
epidermis
periderm
fin
ionocytes / mucous
pigment cells
Expression by stage/cluster
Correlated gene expression
Positive correlation
Negative correlation
Gene
r
Gene
r
LOC110437938
0.276
hmgn7
-0.066
LOC101886926
0.273
rps24
-0.053
si:dkey-202e22.2
0.267
vsig8a
-0.053
spon1a
0.250
rps14
-0.052
BX294160.1
0.249
polr3glb
-0.048
si:dkeyp-85d8.5
0.244
rpl14
-0.046
scn2b
0.236
naa20
-0.046
si:dkeyp-123h10.2
0.227
si:dkey-28b4.7
-0.045
ncam2
0.225
rps6
-0.045
LOC101885083
0.222
dynll1
-0.045
LOC101882015
0.222
psmb1
-0.045
si:ch73-380n15.2
0.221
rnf41l
-0.044
slc25a29b
0.221
h2afvb
-0.044
htr2cl1
0.219
pde6d
-0.044
CR388417.2
0.217
h3f3d
-0.043
gabrg1
0.215
rpl22
-0.043
CABZ01060891.1
0.214
pim3
-0.043
cntnap5b
0.212
hs3st1l2
-0.042
kif26ba
0.211
f11r.1
-0.042
inpp4ab
0.211
cxxc5a
-0.042
csmd1a
0.210
phc2b
-0.042
LOC103911233
0.210
sprn2
-0.041
LOC100537263
0.208
wdr5
-0.041
CABZ01117780.1
0.205
abhd2b
-0.041
syt1b
0.205
atp2b1b
-0.041
vsnl1b
0.204
smndc1
-0.041
zgc:85722
0.203
capsla
-0.041
atp2b3b
0.202
aldh9a1a.1
-0.041
rhot1b
0.202
scn3b
-0.040
ywhag1
0.199
rps16
-0.040
ptprea
0.199
cdc25d
-0.040
CABZ01068352.1
0.199
si:rp71-17i16.6
-0.039
gpr185b
0.197
si:ch211-248e11.2
-0.039
lenep
0.195
smc1al
-0.039
si:cabz01090193.1
0.194
CABZ01037298.1
-0.039