Daniocell
si:dkeyp-77h1.4 (endoderm)
si:dkeyp-77h1.4
ZFIN
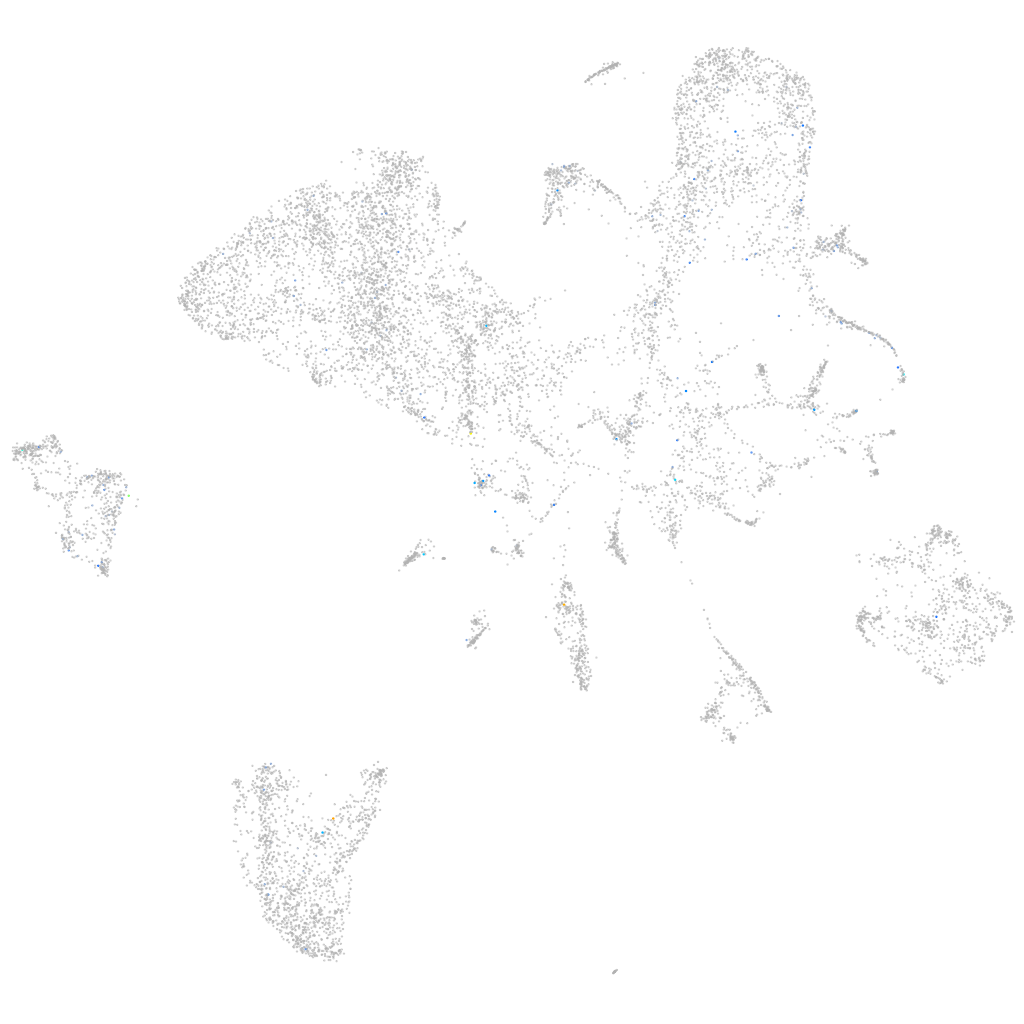
Gene expression UMAP
Display:
Expression
Stage
Other cell groups
all cells
blastomeres
PGCs
endoderm
axial mesoderm
muscle
mural cells /
non-skeletal muscle
mesenchyme
hematopoietic /
vasculature
pronephros
neural
spinal cord / glia
eye
taste / olfactory
otic / lateral line
epidermis
periderm
fin
ionocytes / mucous
pigment cells
Expression by stage/cluster
Correlated gene expression
Positive correlation
Negative correlation
Gene
r
Gene
r
RF00069
0.355
sec61b
-0.041
LOC101882264
0.316
pnp4b
-0.038
XLOC-016343
0.296
zgc:92744
-0.038
BX682558.1
0.270
gamt
-0.037
vwc2
0.263
agxtb
-0.037
si:ch211-197l9.5
0.259
LOC110437731
-0.037
XLOC-039631
0.259
mat1a
-0.037
LOC103911313
0.243
grhprb
-0.036
sult1st7
0.241
etnppl
-0.036
si:dkey-192d15.2
0.235
apom
-0.035
LOC101884777
0.228
fabp10a
-0.035
b3galt1b
0.226
gpd1b
-0.035
LOC101882128
0.225
aqp12
-0.035
si:ch1073-178p5.3
0.223
ttr
-0.035
si:ch211-218o21.4
0.219
fgg
-0.035
kctd15a
0.204
pgm1
-0.034
CABZ01030107.1
0.197
gc
-0.034
cx55.5
0.191
bhmt
-0.034
zgc:174314
0.180
cfhl4
-0.034
CABZ01069184.1
0.177
pcbd1
-0.033
abi3bpa
0.174
si:dkey-86l18.10
-0.033
neto1l
0.173
apoc1
-0.033
CABZ01067175.1
0.171
hpda
-0.033
LOC101886853
0.171
comtd1
-0.033
pcdh1g13
0.168
f2
-0.033
LOC108190036
0.165
cyp2ad2
-0.033
znf385b
0.164
cpn1
-0.032
RF00151
0.164
oxct1b
-0.032
npy2r
0.164
proca
-0.032
prkag3b
0.157
fn1b
-0.032
ablim1a
0.156
tfa
-0.032
inpp4b
0.154
ttc36
-0.032
LOC110438555
0.153
gstz1
-0.032
cavin4a
0.153
ftcd
-0.032
pvalb6
0.152
c3a.1
-0.031