Daniocell
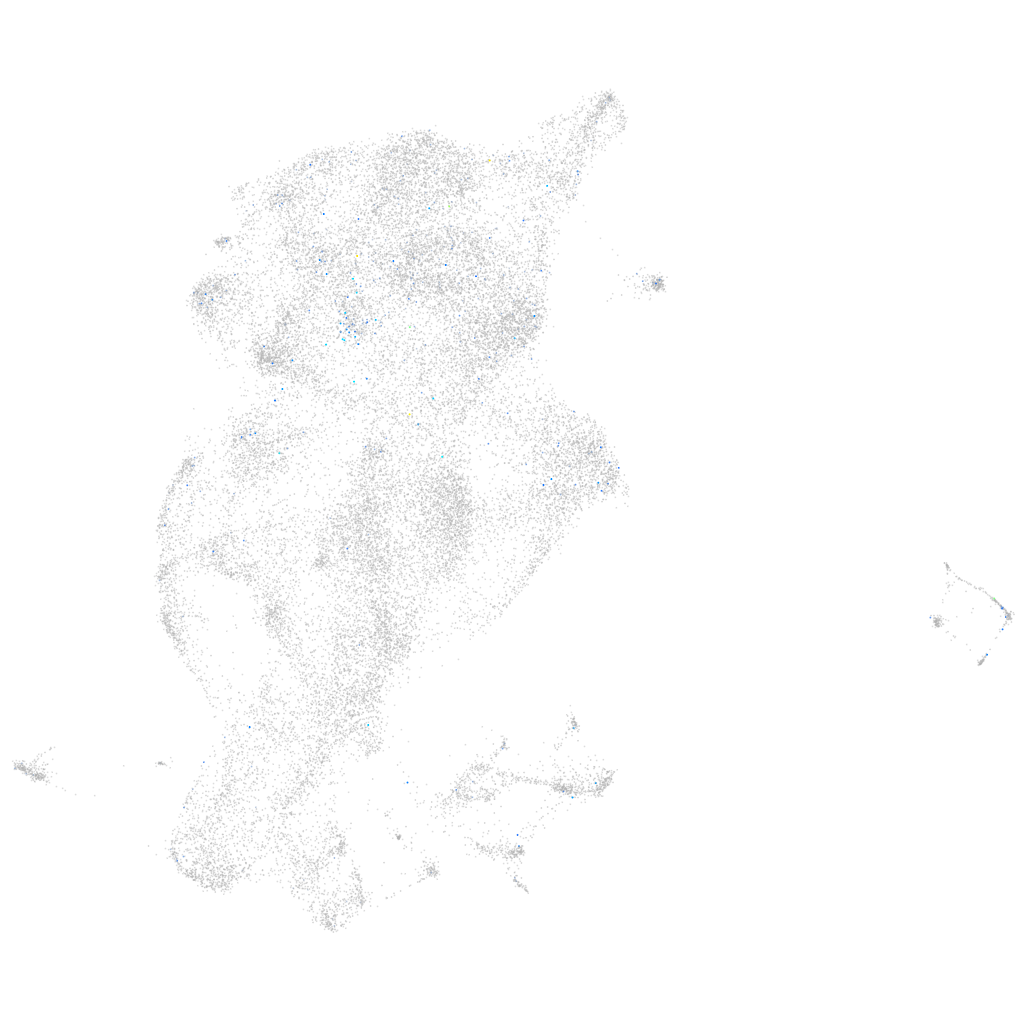
si:dkeyp-73b11.8 (periderm)
si:dkeyp-73b11.8
ZFIN
Gene expression UMAP
Display:
Expression
Stage
Other cell groups
all cells
blastomeres
PGCs
endoderm
axial mesoderm
muscle
mural cells /
non-skeletal muscle
mesenchyme
hematopoietic /
vasculature
pronephros
neural
spinal cord / glia
eye
taste / olfactory
otic / lateral line
epidermis
periderm
fin
ionocytes / mucous
pigment cells
Expression by stage/cluster
Correlated gene expression
Positive correlation
Negative correlation
Gene
r
Gene
r
impg2b
0.175
cst14b.1
-0.052
CELA1
0.170
cyt1l
-0.049
XLOC-017410
0.170
agr1
-0.047
XLOC-043449
0.165
si:ch211-195b11.3
-0.046
si:ch211-137i24.10
0.127
icn
-0.045
hrh2b
0.125
krt4
-0.042
otop2
0.118
zgc:174938
-0.042
si:ch73-160i9.2
0.118
anxa1c
-0.041
prg4a
0.115
wu:fb18f06
-0.041
si:ch211-238e22.5
0.111
gstp1
-0.039
lgals2b
0.109
ywhaz
-0.039
SLC15A5
0.104
cyt1
-0.038
zgc:153031
0.102
osgn1
-0.037
actn2a
0.101
ANXA1 (1 of many)
-0.035
si:ch211-284k5.2
0.098
aep1
-0.035
XLOC-043372
0.097
zgc:193505
-0.034
si:ch211-133l5.7
0.095
adh8b
-0.034
BX000991.1
0.093
cav2
-0.033
XLOC-031233
0.092
zgc:153284
-0.033
si:ch211-181l5.2
0.091
gsnb
-0.033
BX005054.1
0.089
gale
-0.033
plcxd3
0.086
capns1b
-0.033
CR356222.1
0.086
si:cabz01007794.1
-0.032
lft1
0.086
si:ch211-157c3.4
-0.032
fabp2
0.085
tmsb1
-0.031
abcg5
0.082
si:dkey-74k8.3
-0.031
IZUMO1R
0.082
icn2
-0.031
apoa4b.1
0.082
zgc:112964
-0.031
hnf1ba
0.081
zgc:175088
-0.031
LOC110440049
0.081
s100a10b
-0.031
BX649476.1
0.081
cxcl14
-0.031
CABZ01081908.1
0.080
kdelr2b
-0.030
si:ch1073-126c3.2
0.079
ost4
-0.030
BX324007.2
0.078
si:dkey-184p9.7
-0.029
zgc:195356
0.078
naalad2
-0.029