Daniocell
si:dkeyp-73b11.8 (epidermis)
si:dkeyp-73b11.8
ZFIN
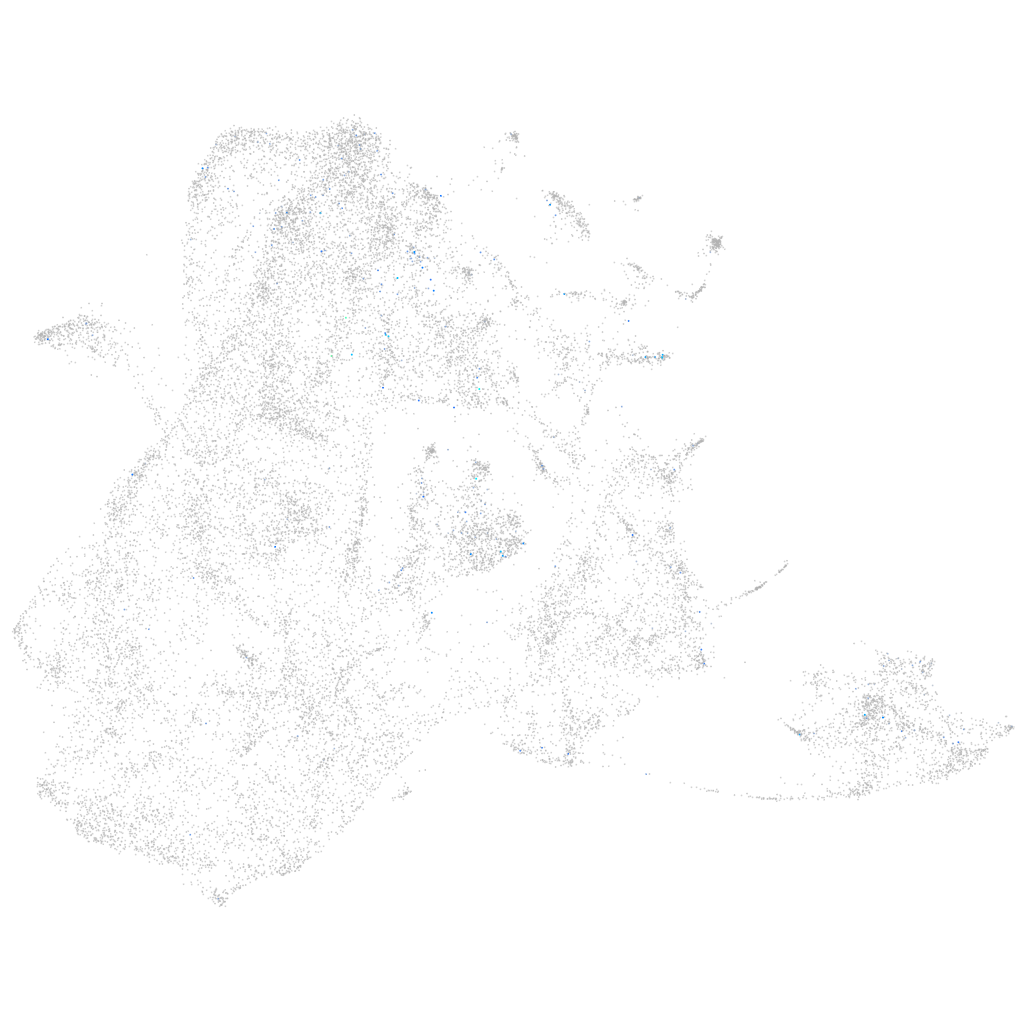
Gene expression UMAP
Display:
Expression
Stage
Other cell groups
all cells
blastomeres
PGCs
endoderm
axial mesoderm
muscle
mural cells /
non-skeletal muscle
mesenchyme
hematopoietic /
vasculature
pronephros
neural
spinal cord / glia
eye
taste / olfactory
otic / lateral line
epidermis
periderm
fin
ionocytes / mucous
pigment cells
Expression by stage/cluster
Correlated gene expression
Positive correlation
Negative correlation
Gene
r
Gene
r
GPR151
0.150
rplp2l
-0.044
edil3b
0.133
si:ch211-222l21.1
-0.040
cacng5b
0.132
pabpc1a
-0.039
gpr171
0.131
rps12
-0.039
or137-2
0.126
si:dkey-151g10.6
-0.037
si:dkeyp-104b3.1
0.119
tpm4a
-0.037
tm4sf4
0.119
p3h1
-0.036
HTRA2 (1 of many).11
0.119
rpl13a
-0.036
CU856343.1
0.118
si:ch73-281n10.2
-0.035
si:ch211-137j23.7
0.118
fkbp9
-0.035
LOC103909163
0.117
sdr16c5a
-0.035
tssk6
0.117
gng5
-0.034
BX005321.1
0.111
asph
-0.033
si:ch73-160i9.2
0.109
hmga1a
-0.033
mrc1a
0.108
rrbp1b
-0.033
stoml3b
0.108
rps5
-0.032
si:dkey-28d5.9
0.107
myl12.1
-0.032
BX539310.1
0.106
rpe65b
-0.032
BX664625.3
0.105
rpl10
-0.032
fut8b
0.103
p4ha1b
-0.032
lgals2b
0.102
zgc:153675
-0.032
LOC103909566
0.102
fermt1
-0.031
si:dkey-88e18.2
0.102
eif4h
-0.031
si:dkey-83f18.9
0.101
pak2a
-0.031
adcyap1a
0.099
cfl1l
-0.031
plac8.1
0.099
alcama
-0.031
si:dkey-190j3.2
0.098
dag1
-0.031
si:dkey-82i20.1
0.098
sept2
-0.030
kcnk10a
0.098
arpc5a
-0.030
BX957317.3
0.097
sec61g
-0.030
nmbb
0.097
tmem263
-0.030
si:ch211-225k7.3
0.097
snrpf
-0.030
adgre16
0.097
sub1a
-0.030
clrn3
0.096
gpx8
-0.030
adgrf3a
0.095
serf2
-0.030