Daniocell
si:ch73-36p18.4 (pronephros)
si:ch73-36p18.4
ZFIN
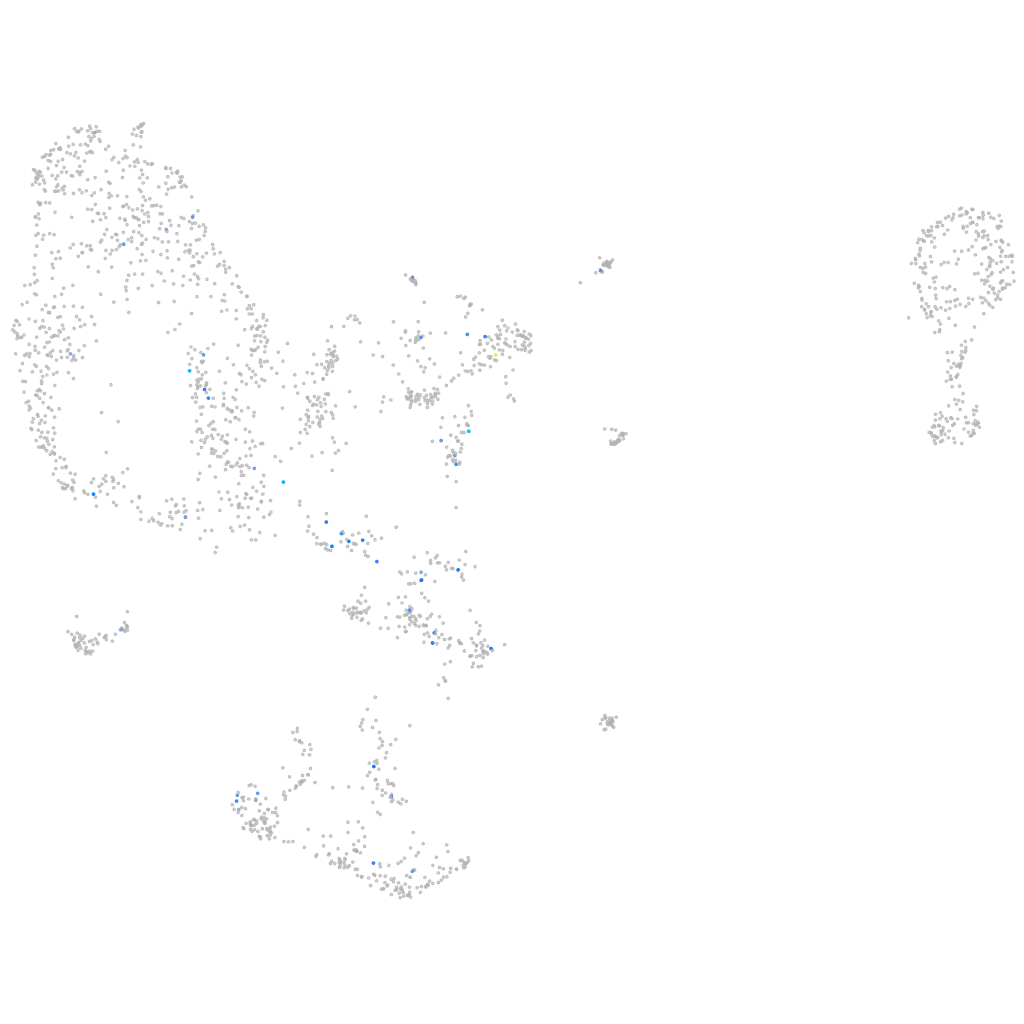
Gene expression UMAP
Display:
Expression
Stage
Other cell groups
all cells
blastomeres
PGCs
endoderm
axial mesoderm
muscle
mural cells /
non-skeletal muscle
mesenchyme
hematopoietic /
vasculature
pronephros
neural
spinal cord / glia
eye
taste / olfactory
otic / lateral line
epidermis
periderm
fin
ionocytes / mucous
pigment cells
Expression by stage/cluster
Correlated gene expression
Positive correlation
Negative correlation
Gene
r
Gene
r
cnksr2a
0.426
tmem174
-0.060
XLOC-025298
0.423
acy1
-0.060
LOC101886468
0.410
agxtb
-0.060
CABZ01070469.1
0.300
dhrs9
-0.058
zgc:194989
0.288
slc2a11l
-0.057
dok4
0.283
fbp1b
-0.056
si:dkey-23a13.5
0.278
oplah
-0.056
XLOC-043650
0.272
rgn
-0.056
si:ch211-216b21.2
0.261
si:dkey-197j19.5
-0.055
nr4a2a
0.252
xirp1
-0.055
si:dkey-3p4.7
0.248
slc47a4
-0.054
kirrel3a
0.244
eps8l3b
-0.054
slc25a47b
0.239
rpl6
-0.054
LOC100334054
0.238
haao
-0.054
BX248082.1
0.238
si:dkey-4e7.3
-0.053
LO017938.1
0.235
slc22a7b.1
-0.053
tmem264
0.234
g6pca.2
-0.052
zgc:174690
0.231
LOC101886255
-0.052
unc5db
0.225
si:ch211-201h21.5
-0.052
si:dkey-261m9.17
0.220
csad
-0.052
FQ377918.1
0.217
gapdh
-0.051
zgc:114175
0.212
gamt
-0.050
nrn1la
0.210
ctsh
-0.050
si:dkey-189h5.6
0.209
etnppl
-0.049
pak6a
0.208
si:dkeyp-72g9.4
-0.049
ca16b
0.207
fahd1
-0.048
XLOC-011085
0.205
pck2
-0.048
zgc:165555.3
0.205
rps18
-0.048
crtc1b
0.205
gpt2l
-0.048
cyth4b
0.203
cox5b2
-0.048
myha
0.202
slc16a1b
-0.048
si:ch211-249o11.5
0.201
aldh16a1
-0.047
cd164l2
0.199
ak4
-0.047
hist1h4l.3
0.192
rdh1
-0.047
fstl5
0.190
pepd
-0.047