Daniocell
si:ch73-36p18.4 (pigment cells)
si:ch73-36p18.4
ZFIN
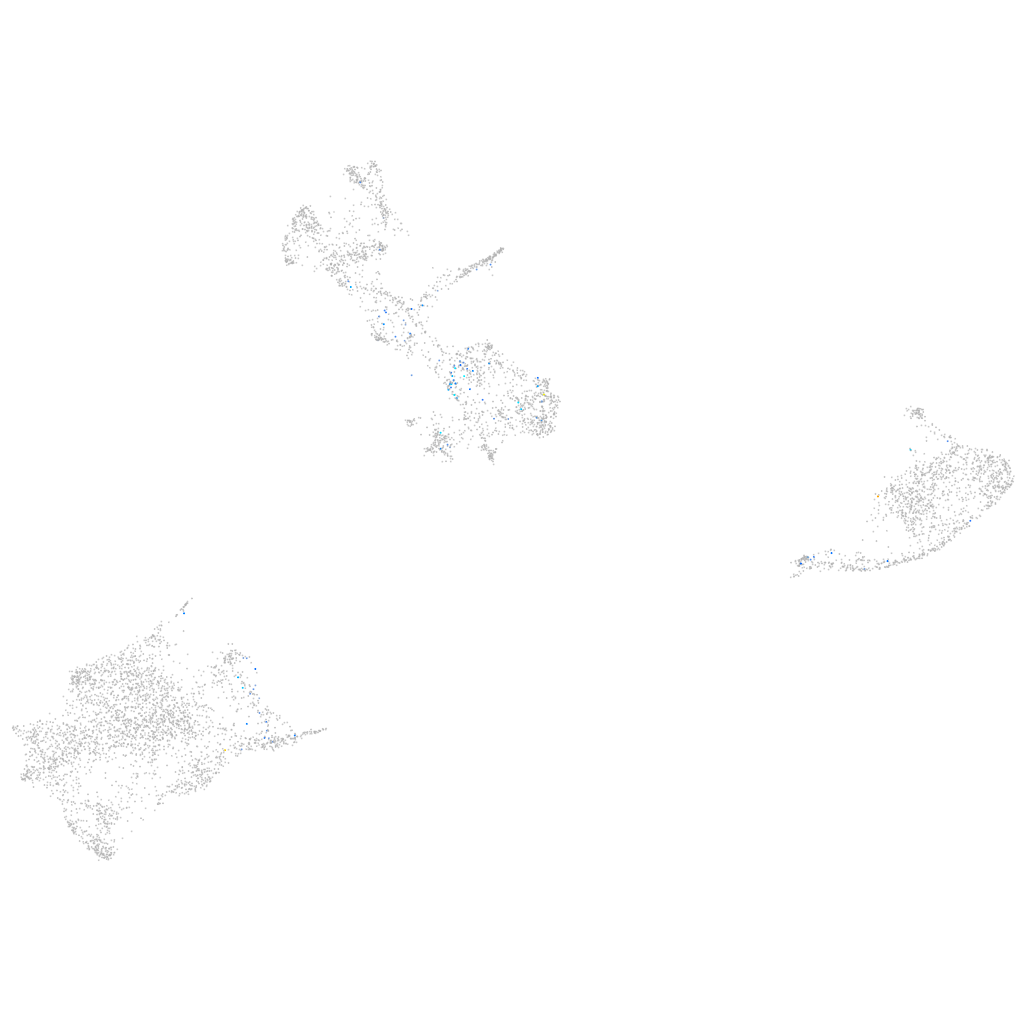
Gene expression UMAP
Display:
Expression
Stage
Other cell groups
all cells
blastomeres
PGCs
endoderm
axial mesoderm
muscle
mural cells /
non-skeletal muscle
mesenchyme
hematopoietic /
vasculature
pronephros
neural
spinal cord / glia
eye
taste / olfactory
otic / lateral line
epidermis
periderm
fin
ionocytes / mucous
pigment cells
Expression by stage/cluster
Correlated gene expression
Positive correlation
Negative correlation
Gene
r
Gene
r
XLOC-007518
0.319
gstp1
-0.061
si:ch211-163l21.8
0.268
zgc:110339
-0.060
CR847998.1
0.248
uraha
-0.058
CCKBR
0.203
mdh1aa
-0.053
htr3a
0.192
csrp2
-0.049
XLOC-007195
0.191
nupr1a
-0.049
zgc:172075
0.189
phyhd1
-0.049
mis12
0.189
krt18b
-0.048
ecm1a
0.184
slc22a7a
-0.047
zgc:158258
0.178
cd63
-0.044
nectin4b
0.171
aldh9a1a.1
-0.042
si:ch73-106k19.2
0.171
si:dkey-251i10.2
-0.041
rrm2
0.166
bhlhe41
-0.038
zgc:165555.3
0.165
gabarapa
-0.037
CU570682.1
0.165
ucp2
-0.037
ca7
0.162
aldob
-0.037
zgc:110540
0.161
LOC101886030
-0.037
optc
0.161
gch2
-0.036
LOC110439111
0.157
actb2
-0.036
fbxo5
0.157
si:dkey-204f11.64
-0.036
CABZ01005379.1
0.156
krt8
-0.036
cd247l
0.154
pmp22b
-0.036
si:dkey-261m9.17
0.149
rhag
-0.035
BX936303.2
0.147
oacyl
-0.034
chaf1a
0.144
LOC103909099
-0.034
suv39h1b
0.144
pfn1
-0.033
cenpn
0.143
ahnak
-0.033
zgc:110425
0.141
gyg1b
-0.033
tgm1
0.140
glrx
-0.032
moxd1l
0.139
oxr1b
-0.032
haus4
0.139
si:ch211-251b21.1
-0.032
fam83d
0.137
cox4i2
-0.032
mcph1
0.137
pts
-0.032
LOC101884966
0.137
nfe2l2a
-0.032
si:dkey-108k21.10
0.136
rasd1
-0.032