Daniocell
si:ch211-74m13.3 (taste / olfactory)
si:ch211-74m13.3 [Source:ZFIN;Acc:ZDB-GENE-060503-219]
ZFIN
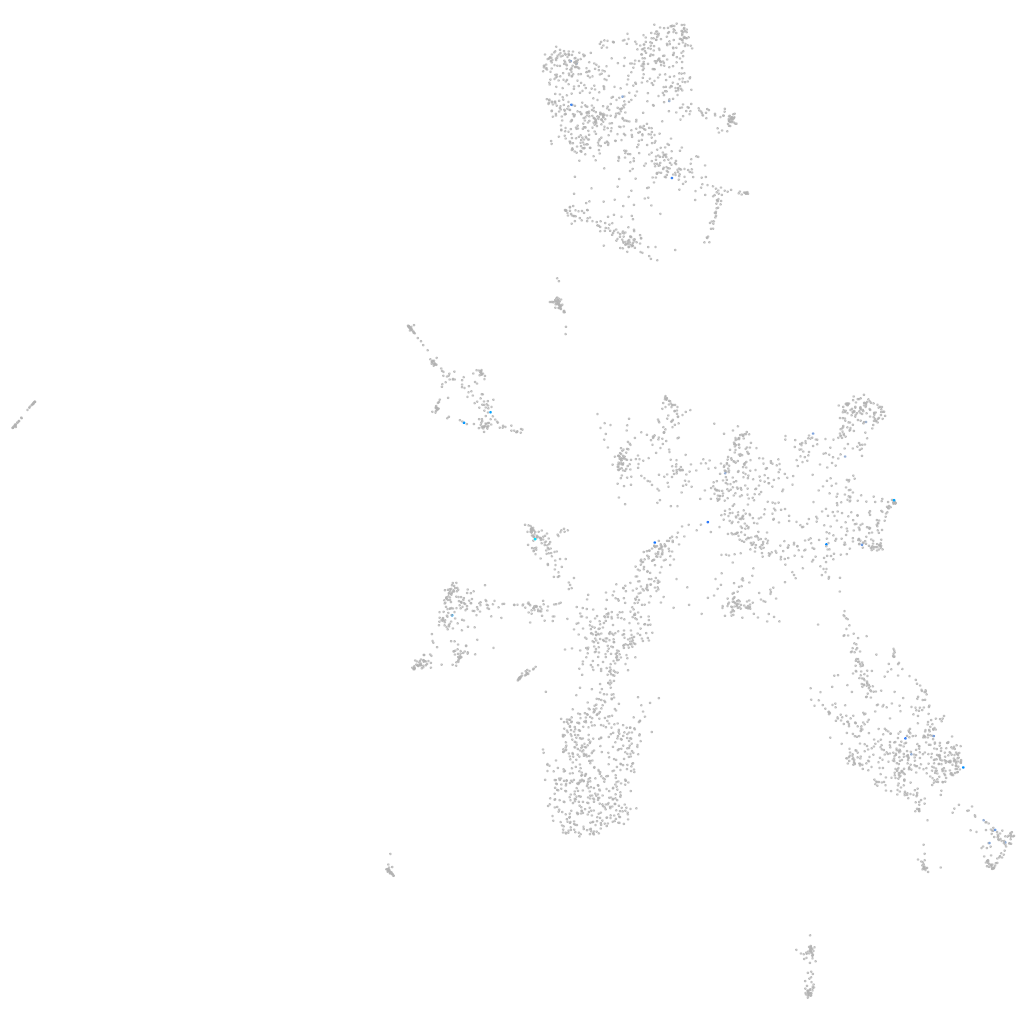
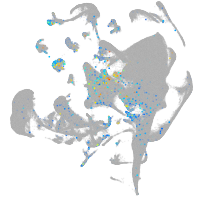
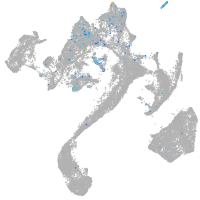
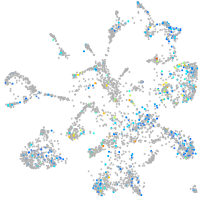
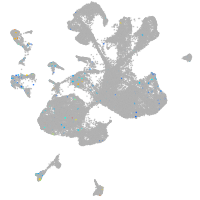
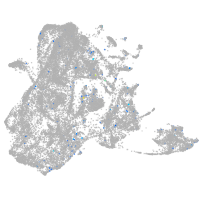
Gene expression UMAP
Display:
Expression
Stage
Other cell groups
all cells
blastomeres
PGCs
endoderm
axial mesoderm
muscle
mural cells /
non-skeletal muscle
mesenchyme
hematopoietic /
vasculature
pronephros
neural
spinal cord / glia
eye
taste / olfactory
otic / lateral line
epidermis
periderm
fin
ionocytes / mucous
pigment cells
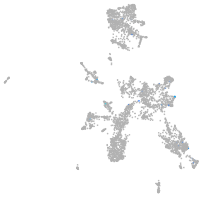
Expression by stage/cluster
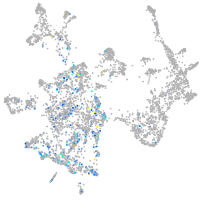
Correlated gene expression
Positive correlation
Negative correlation
Gene
r
Gene
r
LOC101884169
0.441
rplp2
-0.035
LOC108183612
0.330
atp6v1ba
-0.032
cyp2k21
0.306
map7d2b
-0.031
XLOC-013065
0.306
alg5
-0.030
si:ch211-157b11.8
0.300
glyr1
-0.030
si:dkey-112g5.15
0.297
pafah1b1b
-0.029
si:ch211-108c6.2
0.290
cpe
-0.029
LOC101882843
0.237
si:dkey-112e7.2
-0.028
slc2a6
0.226
icn2
-0.027
drd1b
0.224
gnao1a
-0.027
si:dkey-91i10.3
0.222
cd99l2
-0.027
BX649533.1
0.207
sephs2
-0.027
si:ch73-383g2.1
0.207
ndufb10
-0.027
obsl1b
0.205
rap2c
-0.027
FO681472.1
0.203
bola1
-0.027
BX119963.3
0.200
nckap1
-0.027
lepa
0.200
gtpbp4
-0.027
XLOC-016822
0.195
gnal
-0.026
itgae.2
0.191
fundc1
-0.026
cryabb
0.186
oclna
-0.026
selp
0.183
elf2a
-0.026
kncn
0.180
dhdds
-0.026
olfml2a
0.179
ywhag2
-0.026
pimr131
0.177
nfyc
-0.026
si:ch211-1o7.3
0.174
tmem9b
-0.026
CABZ01081777.1
0.169
isg20
-0.025
LOC101884154
0.162
rpl38
-0.025
igsf10
0.162
zgc:112356
-0.025
CR848784.4
0.159
LOC103909115
-0.025
XLOC-017471
0.159
gars
-0.025
si:ch211-157j23.3
0.159
elocb
-0.025
zgc:77938
0.158
pgd
-0.025
heg1
0.156
cux1a
-0.024
LOC101886196
0.149
stag2b
-0.024
optc
0.147
nxnl2
-0.024