Daniocell
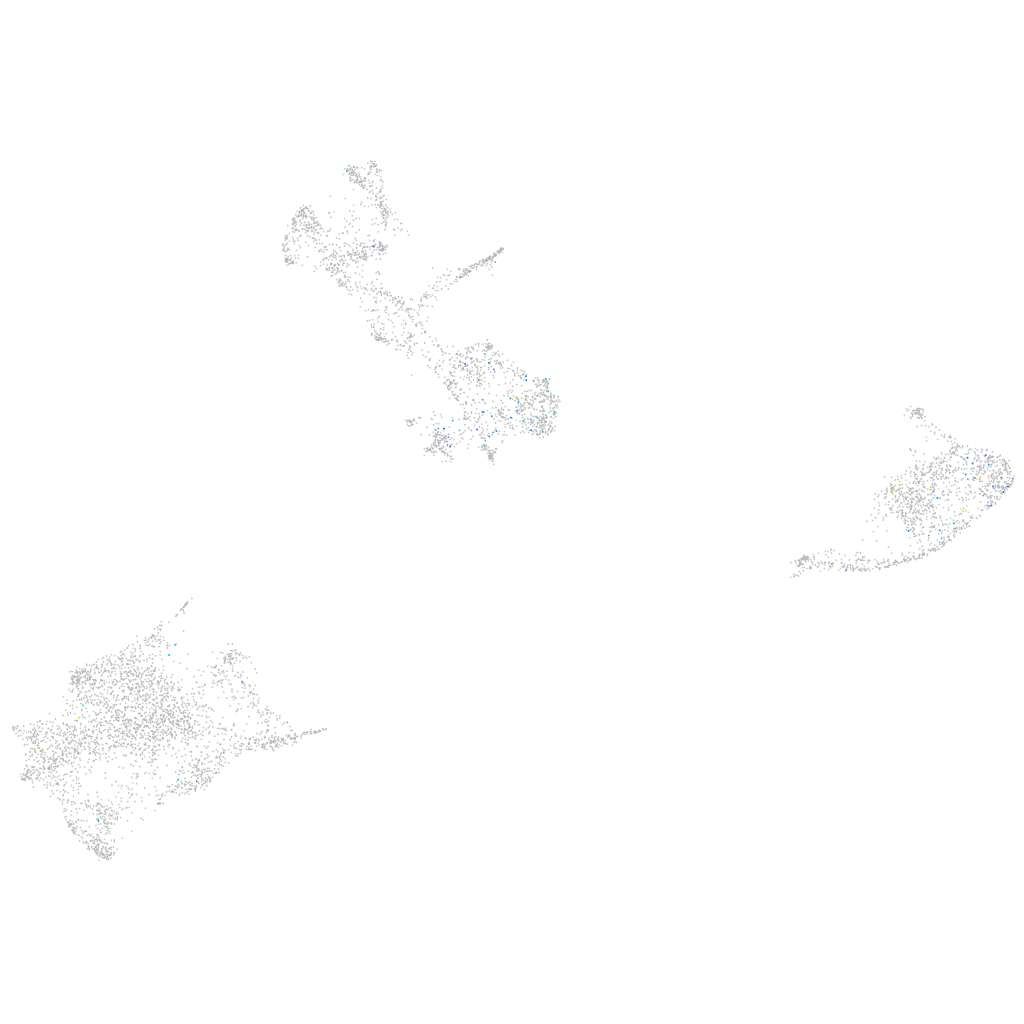
si:ch211-188f17.1 (pigment cells)
si:ch211-188f17.1
ZFIN
Gene expression UMAP
Display:
Expression
Stage
Other cell groups
all cells
blastomeres
PGCs
endoderm
axial mesoderm
muscle
mural cells /
non-skeletal muscle
mesenchyme
hematopoietic /
vasculature
pronephros
neural
spinal cord / glia
eye
taste / olfactory
otic / lateral line
epidermis
periderm
fin
ionocytes / mucous
pigment cells
Expression by stage/cluster
Correlated gene expression
Positive correlation
Negative correlation
Gene
r
Gene
r
itln3
0.218
paics
-0.061
herc7
0.207
glulb
-0.048
FQ377603.1
0.196
atic
-0.047
XLOC-006820
0.178
slc2a15a
-0.047
and4
0.170
prdx5
-0.046
CT573133.2
0.164
impdh1b
-0.046
LOC100537138
0.160
si:dkey-251i10.2
-0.044
mmp20a
0.158
prps1a
-0.044
LOC108190346
0.157
cyb5a
-0.043
tmem41ab
0.153
shmt1
-0.040
cngb1a
0.151
uraha
-0.039
s1pr5a
0.149
gmps
-0.038
zgc:172090
0.148
pmp22b
-0.038
pimr74
0.148
tmem130
-0.037
si:ch211-242f23.8
0.141
CABZ01021592.1
-0.037
BX571675.1
0.134
mdh1aa
-0.036
mkrn2os.1
0.132
akr1b1
-0.035
CR391991.4
0.131
cax1
-0.034
LOC108181081
0.131
slc2a11b
-0.033
si:ch211-173a9.6
0.130
bco1
-0.033
LOC110438136
0.129
pts
-0.033
XLOC-030244
0.126
zgc:165573
-0.033
LOC100537163
0.123
aclya
-0.033
zgc:172182
0.123
krt18b
-0.032
LOC101886386
0.123
ppat
-0.032
BX927369.1
0.122
sult1st1
-0.031
znf1034
0.122
gch2
-0.031
LOC100004978
0.122
TMEM19
-0.031
slc13a3
0.122
anxa4
-0.031
LOC103910871
0.120
rpl26
-0.030
myadml2
0.119
gart
-0.030
si:ch73-106k19.2
0.118
si:zfos-1069f5.1
-0.030
ugt5a2
0.118
napab
-0.030
si:dkeyp-85d8.5
0.115
cmtm6
-0.029
atoh1b
0.114
rpl10a
-0.029