Daniocell
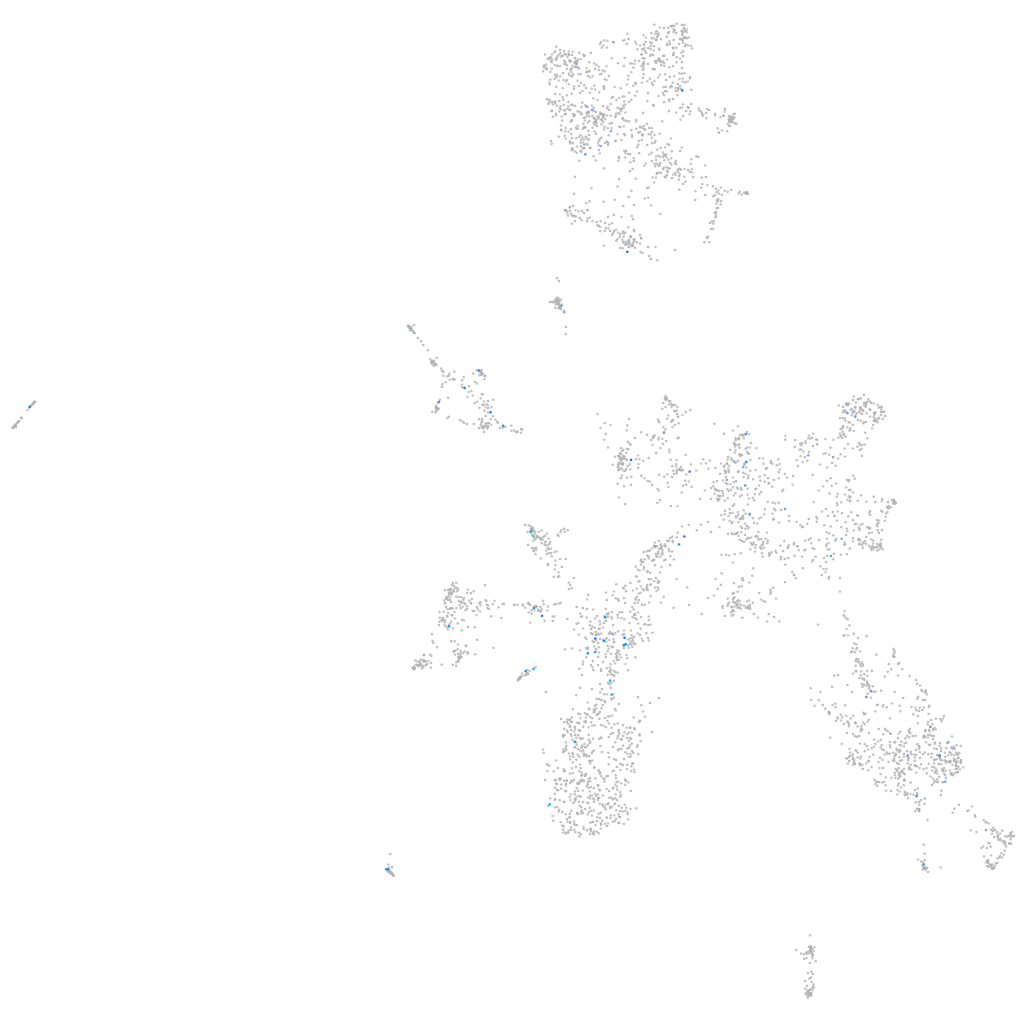
si:ch211-188f17.1 (taste / olfactory)
si:ch211-188f17.1
ZFIN
Gene expression UMAP
Display:
Expression
Stage
Other cell groups
all cells
blastomeres
PGCs
endoderm
axial mesoderm
muscle
mural cells /
non-skeletal muscle
mesenchyme
hematopoietic /
vasculature
pronephros
neural
spinal cord / glia
eye
taste / olfactory
otic / lateral line
epidermis
periderm
fin
ionocytes / mucous
pigment cells
Expression by stage/cluster
Correlated gene expression
Positive correlation
Negative correlation
Gene
r
Gene
r
LOC110437837
0.249
icn
-0.069
atp6v1c2
0.237
nqo1
-0.053
RF00322
0.235
krt18a.1
-0.052
bcl6b
0.216
tmsb1
-0.051
plac8.2
0.195
krt4
-0.051
disp2
0.189
s100v2
-0.047
XLOC-018363
0.189
s100a10b
-0.046
BX914220.1
0.189
serinc2
-0.044
htr1e
0.185
ponzr6
-0.044
LOC103909787
0.178
krt8
-0.044
LO017955.1
0.178
fabp2
-0.044
neto1l
0.176
krt97
-0.044
si:ch73-359m17.11
0.174
calb2a
-0.043
XLOC-000910
0.173
ahnak
-0.043
si:ch211-262i1.4
0.171
phlda2
-0.043
rundc3b
0.171
fuca1.1
-0.042
LOC110438004
0.171
pfn1
-0.042
ftr03
0.166
clic1
-0.042
myha
0.166
cldni
-0.042
BX004800.1
0.166
npm1a
-0.042
neu3.4
0.158
pycard
-0.042
ddr2b
0.158
rarga
-0.041
LO017951.1
0.155
sparc
-0.041
CR855311.5
0.153
pik3r2
-0.041
BX649416.2
0.152
zgc:92242
-0.041
herc7
0.150
si:dkey-71b5.7
-0.040
chs1
0.149
romo1
-0.040
si:ch211-212k5.4
0.143
ube2g2
-0.040
CR774179.2
0.143
plecb
-0.039
si:dkey-49n23.3
0.140
cfl1l
-0.039
si:dkey-193n17.9
0.138
mid1ip1a
-0.039
BX901968.1
0.137
rhbdl2
-0.039
CR936300.1
0.137
emd
-0.038
BX248418.2
0.137
dap1b
-0.038
FP085399.2
0.137
gbgt1l4
-0.038