Daniocell
si:ch1073-228j22.1 (taste / olfactory)
si:ch1073-228j22.1 [Source:ZFIN;Acc:ZDB-GENE-110411-219]
ZFIN
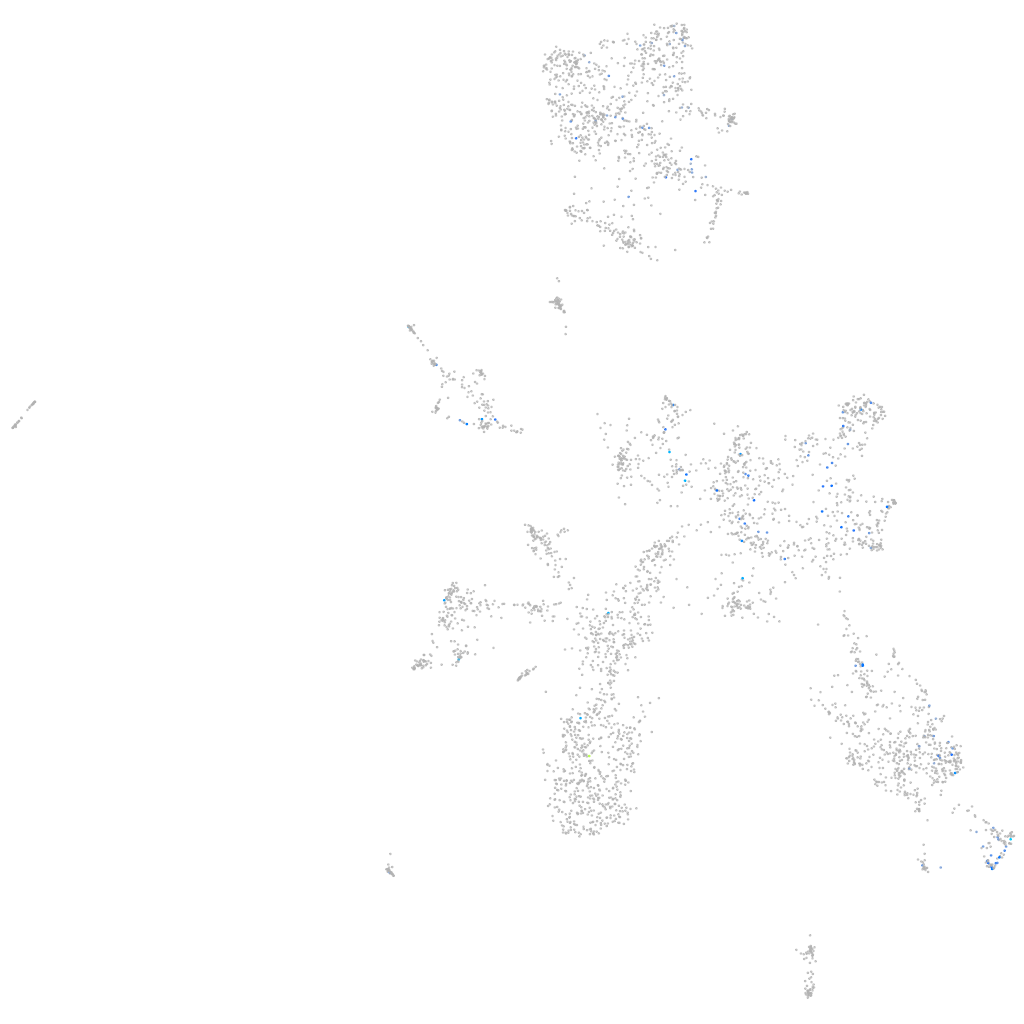
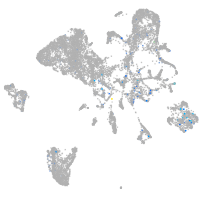
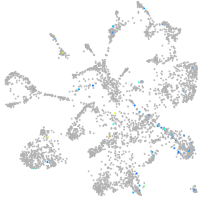
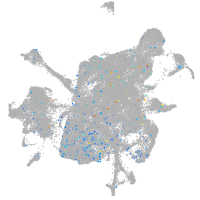
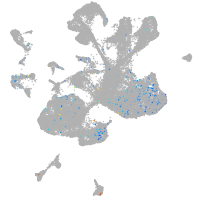
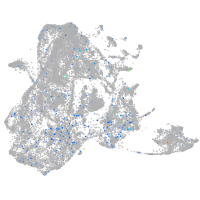
Gene expression UMAP
Display:
Expression
Stage
Other cell groups
all cells
blastomeres
PGCs
endoderm
axial mesoderm
muscle
mural cells /
non-skeletal muscle
mesenchyme
hematopoietic /
vasculature
pronephros
neural
spinal cord / glia
eye
taste / olfactory
otic / lateral line
epidermis
periderm
fin
ionocytes / mucous
pigment cells
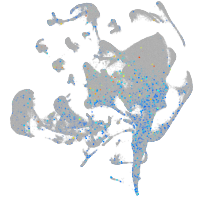
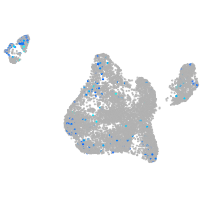
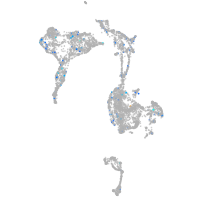
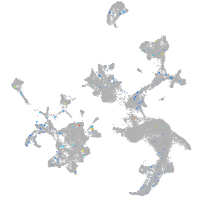
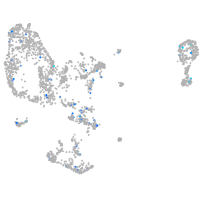
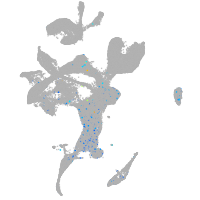
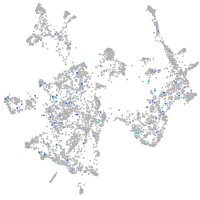
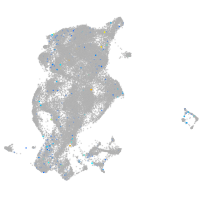
Expression by stage/cluster
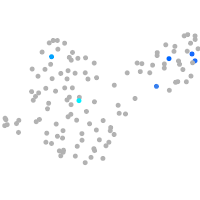
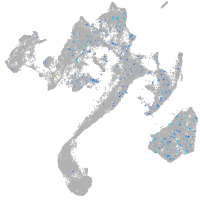
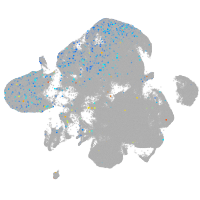
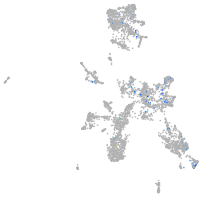
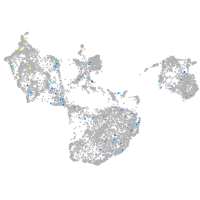
Correlated gene expression
Positive correlation
Negative correlation
Gene
r
Gene
r
krt98
0.186
anxa5b
-0.063
LOC103911615
0.183
ywhah
-0.060
stpg1
0.173
stmn1b
-0.059
LOC103911098
0.172
adgrl3.1
-0.058
LOC110439880
0.171
stxbp1a
-0.058
loxhd1a
0.171
si:ch211-195b15.8
-0.056
CABZ01117752.1
0.168
rtn1a
-0.056
tmem179b
0.167
atp6v0cb
-0.055
obscna
0.164
COX3
-0.055
slc5a2
0.151
calm1a
-0.055
znf1175
0.149
atp2b1a
-0.053
si:ch211-250c4.5
0.149
rnasekb
-0.053
si:ch211-203b8.6
0.147
cldnh
-0.053
LOC110440108
0.143
sncb
-0.052
CABZ01066611.1
0.140
elavl3
-0.051
si:dkeyp-69c1.9
0.138
si:dkey-276j7.1
-0.051
XLOC-043106
0.138
h1fx
-0.050
sept8b
0.134
tuba1c
-0.050
stk33
0.134
olfm1b
-0.050
zmynd12
0.131
zgc:165573
-0.050
BX072561.1
0.131
flrt1b
-0.049
fndc7a
0.130
slc17a6b
-0.049
si:ch211-163l21.7
0.130
rasd3
-0.049
cd81b
0.129
marcksl1b
-0.048
CU137681.3
0.129
atp1a3a
-0.048
BX649516.2
0.129
gdi1
-0.048
fut9d
0.128
ywhag2
-0.047
si:ch211-155m12.5
0.128
march8
-0.046
lrrc18a
0.127
aplp1
-0.046
LOC110440217
0.127
gnb1a
-0.046
rrm1
0.126
adcyap1b
-0.046
dhfr
0.125
spock1
-0.045
LOC108179116
0.124
myt1b
-0.045
si:dkey-98j1.5
0.122
scg2b
-0.045
gb:eh456644
0.121
CR383676.1
-0.045