Daniocell
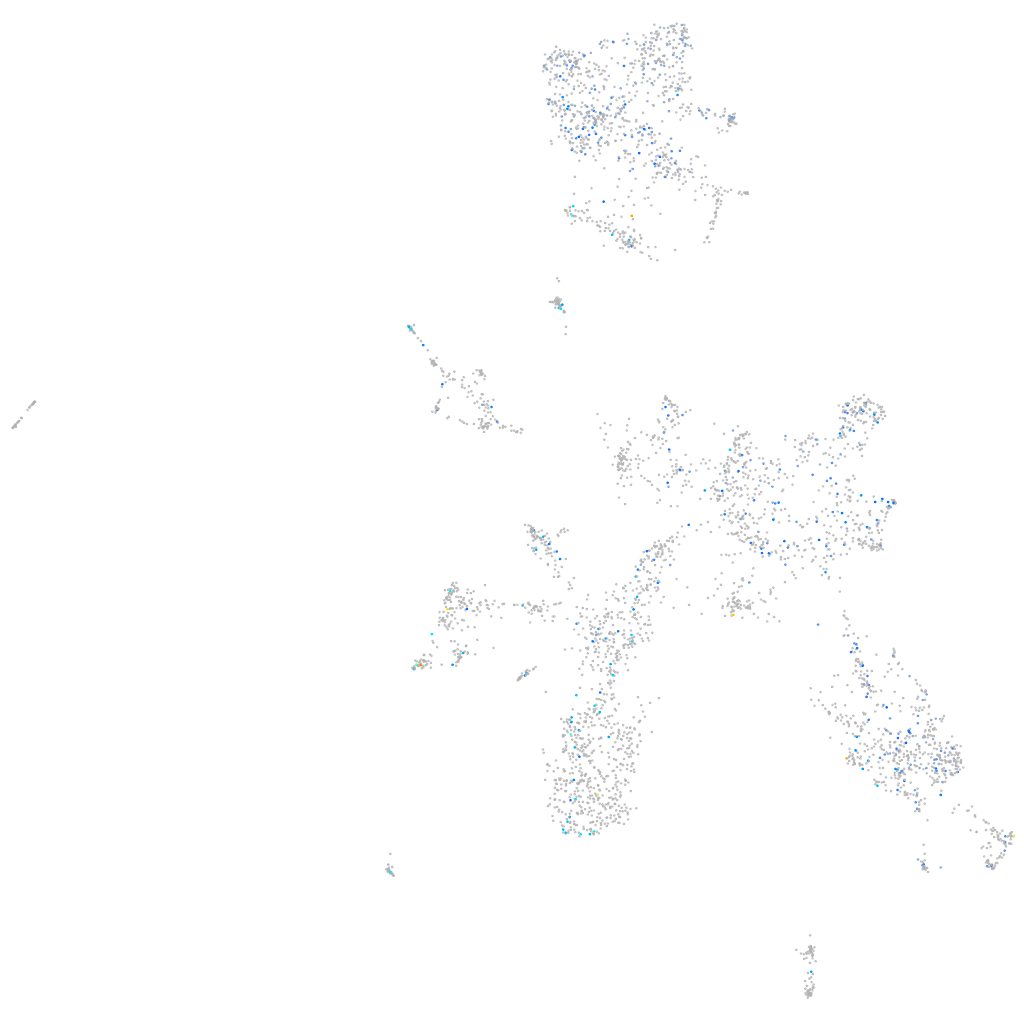
sfxn2 (taste / olfactory)
sideroflexin 2
ZFIN
Gene expression UMAP
Display:
Expression
Stage
Other cell groups
all cells
blastomeres
PGCs
endoderm
axial mesoderm
muscle
mural cells /
non-skeletal muscle
mesenchyme
hematopoietic /
vasculature
pronephros
neural
spinal cord / glia
eye
taste / olfactory
otic / lateral line
epidermis
periderm
fin
ionocytes / mucous
pigment cells
Expression by stage/cluster
Correlated gene expression
Positive correlation
Negative correlation
Gene
r
Gene
r
spo11
0.162
aplp1
-0.051
si:dkey-246j6.3
0.157
nova2
-0.046
ahsg1
0.136
gpm6aa
-0.045
si:ch211-276i6.1
0.126
lrrn1
-0.045
ccdc162
0.126
atp5md
-0.044
BX294444.1
0.119
sv2a
-0.043
LOC108182798
0.118
nmt2
-0.043
FO904898.4
0.116
elavl3
-0.043
AL807792.1
0.115
si:ch211-114c12.2
-0.042
si:ch211-238p8.18
0.115
cdkn3
-0.042
taar18i
0.113
zdhhc1
-0.041
plpp2a
0.112
nptnb
-0.041
si:ch211-236k19.2
0.107
barhl2
-0.041
zgc:112183
0.105
lhx2b
-0.041
npr3
0.105
syt1a
-0.041
LOC103910418
0.105
arhgap19
-0.041
LOC110439537
0.100
man2a2
-0.040
LOC108181518
0.099
tomm70a
-0.040
BX511073.1
0.099
ek1
-0.040
CR352265.3
0.099
cspg5a
-0.039
FP016012.1
0.098
tubgcp5
-0.039
ahsa1a
0.096
serpini1
-0.039
AL928824.1
0.095
ypel5
-0.039
AL954317.1
0.095
stoml3b
-0.038
si:ch73-15n24.1
0.094
si:ch211-270n8.4
-0.038
BX928755.1
0.093
slc8a2b
-0.038
nitr3a
0.093
furinb
-0.037
urad
0.093
trub2
-0.037
LOC108190994
0.093
rfx3
-0.037
XLOC-022898
0.092
usp2b
-0.037
palmdb
0.092
insm1b
-0.037
alkal2b
0.092
ablim1a
-0.037
si:ch73-138e16.6
0.092
slc43a2a
-0.037
LOC110439393
0.092
cdc25d
-0.037
BX470117.1
0.092
XLOC-024343
-0.036