Daniocell
rsph10b (glial cells / spinal cord)
radial spoke head 10 homolog B
ZFIN
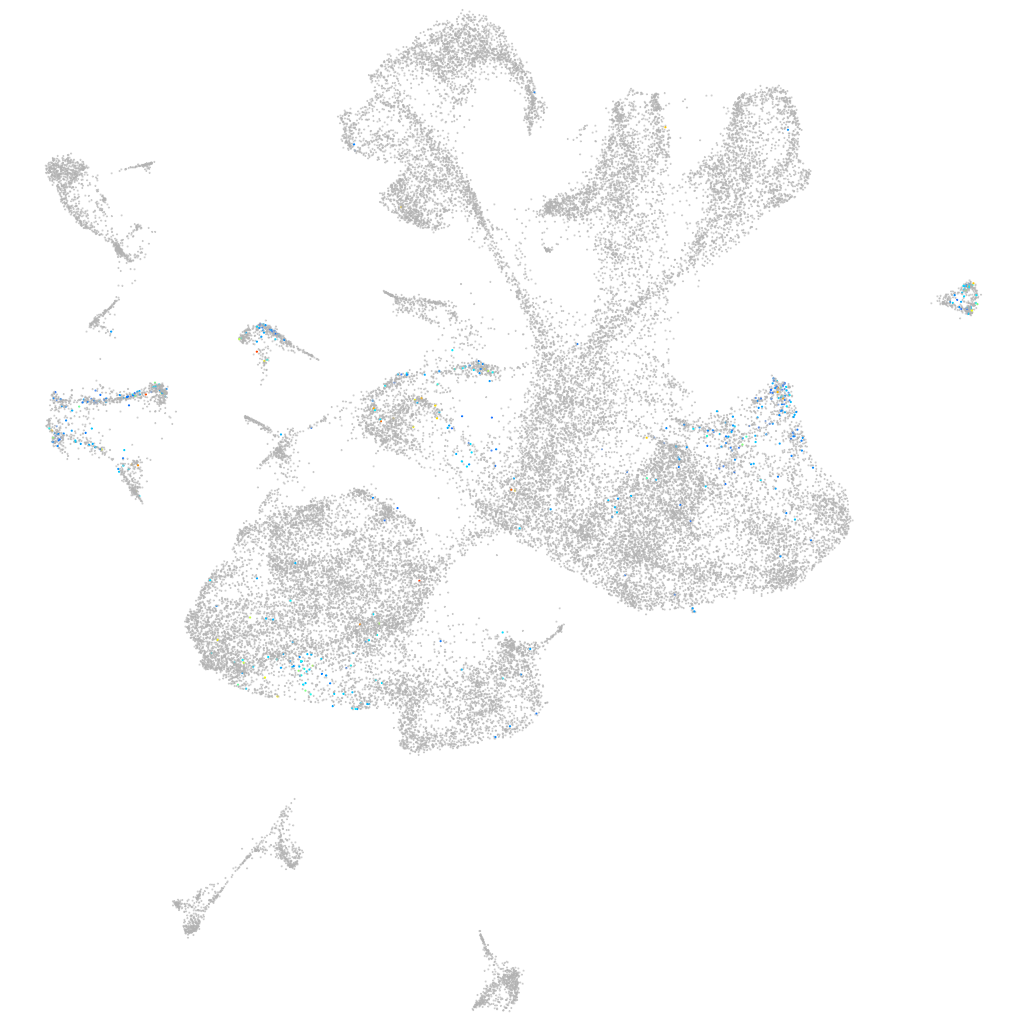
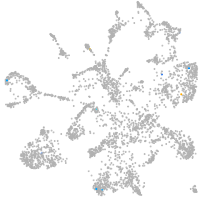
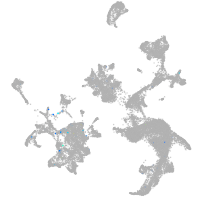
Gene expression UMAP
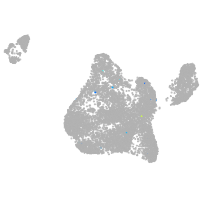
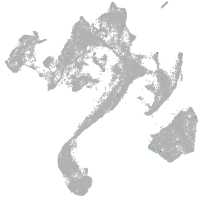
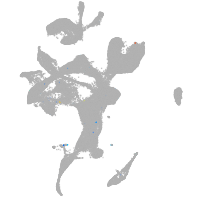
Display:
Expression
Stage
Other cell groups
all cells
blastomeres
PGCs
endoderm
axial mesoderm
muscle
mural cells /
non-skeletal muscle
mesenchyme
hematopoietic /
vasculature
pronephros
neural
spinal cord / glia
eye
taste / olfactory
otic / lateral line
epidermis
periderm
fin
ionocytes / mucous
pigment cells
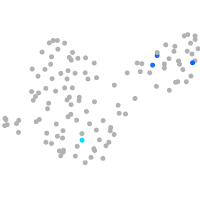
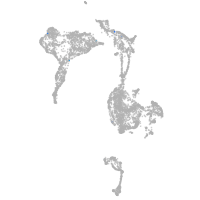
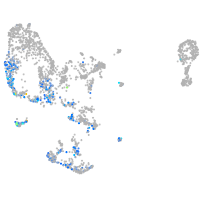
Expression by stage/cluster
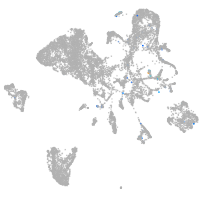
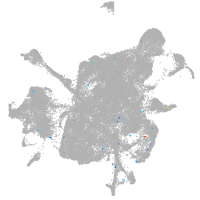
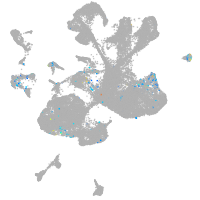
Correlated gene expression
Positive correlation
Negative correlation
Gene
r
Gene
r
enkur
0.176
hmgb3a
-0.051
meig1
0.168
ptmab
-0.051
smkr1
0.166
elavl3
-0.050
daw1
0.165
hnrnpaba
-0.045
tbata
0.165
tmsb4x
-0.044
ccdc114
0.164
apex1
-0.043
cfap100
0.163
stmn1b
-0.043
pacrg
0.155
si:ch211-288g17.3
-0.041
si:ch211-248e11.2
0.155
tmsb
-0.041
ak7a
0.155
si:ch73-386h18.1
-0.040
rab36
0.153
myt1b
-0.039
ropn1l
0.150
nova1
-0.038
si:ch211-155m12.5
0.150
si:ch211-137a8.4
-0.038
si:dkey-148f10.4
0.149
fabp3
-0.037
spata18
0.147
tubb2b
-0.037
cfap45
0.143
cirbpb
-0.036
zgc:55461
0.139
scrt2
-0.036
ribc2
0.138
si:dkey-276j7.1
-0.036
si:dkey-42p14.3
0.137
marcksb
-0.035
si:ch211-163l21.7
0.136
setb
-0.035
ttc25
0.136
onecut2
-0.035
ccdc151
0.136
myt1a
-0.035
ccdc146
0.135
ptmaa
-0.034
spag6
0.129
cnp
-0.034
si:dkeyp-69c1.9
0.129
eif4ebp1
-0.034
si:dkey-11c5.11
0.128
hmgb1a
-0.034
cfap57
0.128
smarce1
-0.034
morn3
0.126
FO082781.1
-0.034
si:ch211-57m13.9
0.126
tubb5
-0.034
spag8
0.126
sox11b
-0.034
dnali1
0.126
elavl4
-0.033
RSPH1
0.126
hmgb1b
-0.033
lrrc6
0.125
seta
-0.033
LOC100329490
0.125
h3f3d
-0.033
si:ch211-226m7.4
0.124
LOC798783
-0.033