
"ribonuclease, RNase K a"
ZFIN 
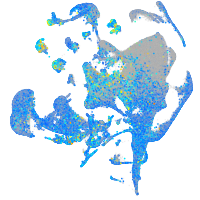
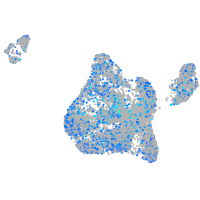
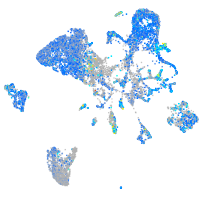
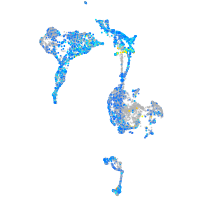
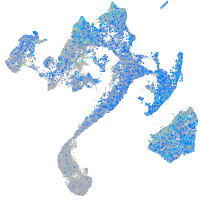
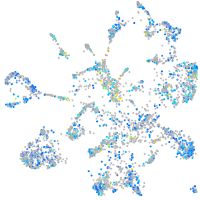
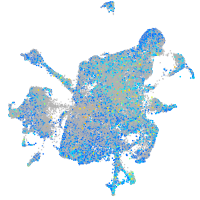
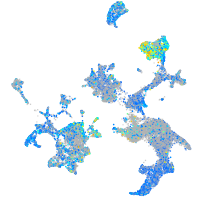
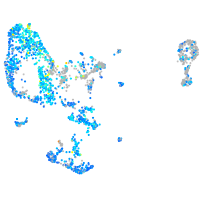
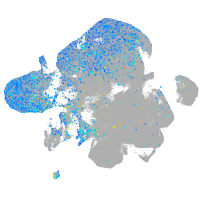
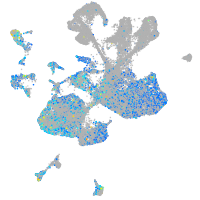
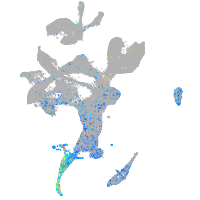
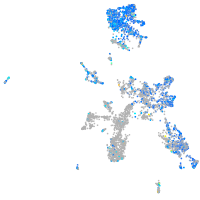
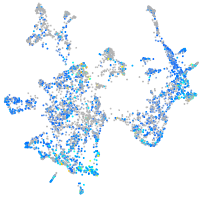
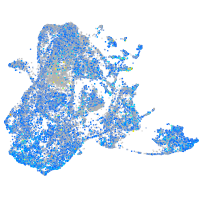
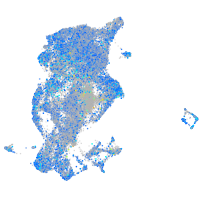
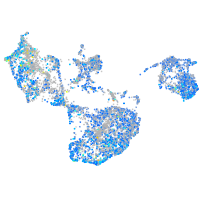
Gene expression UMAP


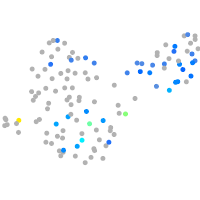
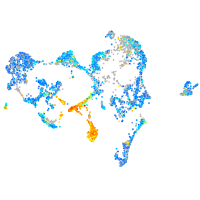
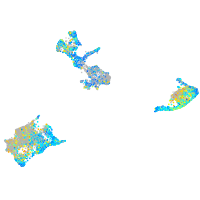
Expression by stage/cluster
Correlated gene expression
| Positive correlation | Negative correlation | ||
| Gene | r | Gene | r |
| qki2 | 0.201 | elavl3 | -0.222 |
| cd63 | 0.192 | myt1b | -0.202 |
| atp1b1a | 0.189 | tmsb | -0.172 |
| vamp3 | 0.187 | stxbp1a | -0.163 |
| sparc | 0.186 | stx1b | -0.162 |
| efhd1 | 0.185 | rtn1a | -0.159 |
| id1 | 0.182 | hmgb3a | -0.158 |
| si:ch211-286b5.5 | 0.180 | elavl4 | -0.158 |
| npc2 | 0.177 | gng2 | -0.156 |
| pgrmc1 | 0.171 | sncb | -0.155 |
| sept10 | 0.169 | snap25a | -0.155 |
| si:ch211-66e2.5 | 0.165 | gng3 | -0.153 |
| si:dkey-204f11.64 | 0.165 | si:dkey-276j7.1 | -0.152 |
| glula | 0.164 | ptmab | -0.152 |
| ppap2d | 0.162 | syt2a | -0.150 |
| fosab | 0.161 | tubb5 | -0.150 |
| slc3a2a | 0.159 | nova2 | -0.149 |
| cx43 | 0.157 | cplx2 | -0.147 |
| si:dkey-7j14.6 | 0.156 | myt1a | -0.144 |
| rpz5 | 0.156 | stmn1b | -0.144 |
| fabp7a | 0.155 | vamp2 | -0.143 |
| sdcbp2 | 0.153 | onecut1 | -0.142 |
| GCA | 0.153 | nsg2 | -0.142 |
| anxa11b | 0.152 | rtn1b | -0.141 |
| hepacama | 0.151 | LOC100537384 | -0.140 |
| jun | 0.151 | jagn1a | -0.140 |
| sox2 | 0.148 | scrt2 | -0.138 |
| id3 | 0.147 | ywhah | -0.137 |
| cox4i2 | 0.146 | stmn2a | -0.137 |
| sept8b | 0.146 | tmem59l | -0.136 |
| anxa13 | 0.145 | zc4h2 | -0.136 |
| her6 | 0.144 | tuba1c | -0.136 |
| itm2ba | 0.144 | h3f3d | -0.135 |
| psat1 | 0.144 | rbfox1 | -0.135 |
| psph | 0.142 | gap43 | -0.135 |