Daniocell
ribc2 (fin)
RIB43A domain with coiled-coils 2
ZFIN
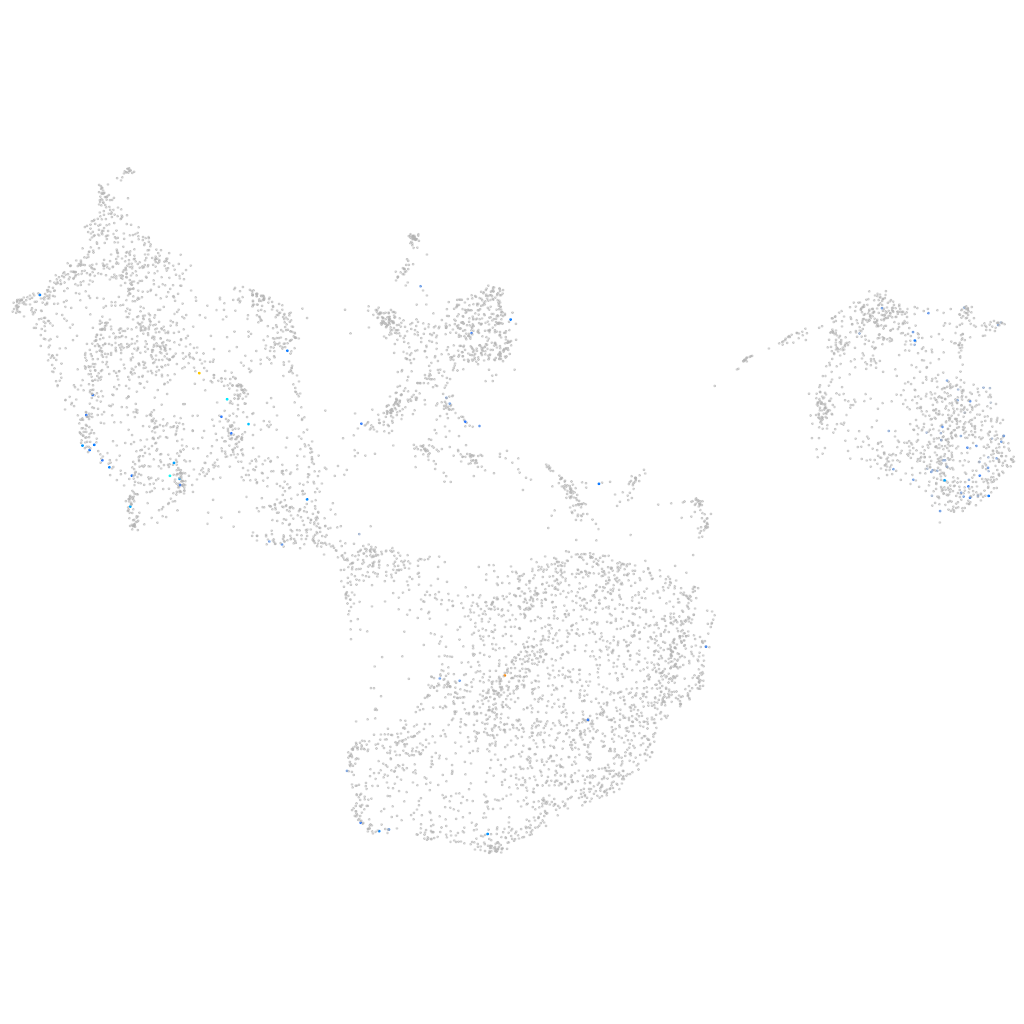
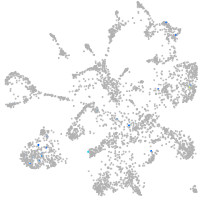
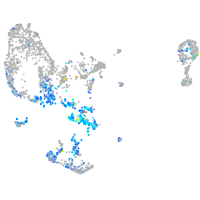
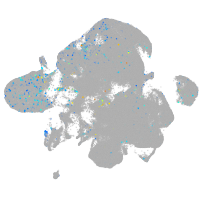
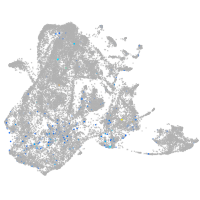
Gene expression UMAP
Display:
Expression
Stage
Other cell groups
all cells
blastomeres
PGCs
endoderm
axial mesoderm
muscle
mural cells /
non-skeletal muscle
mesenchyme
hematopoietic /
vasculature
pronephros
neural
spinal cord / glia
eye
taste / olfactory
otic / lateral line
epidermis
periderm
fin
ionocytes / mucous
pigment cells
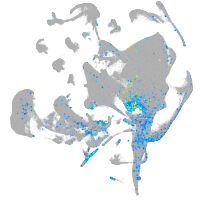
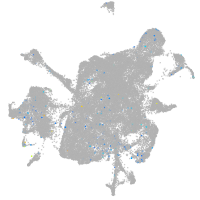
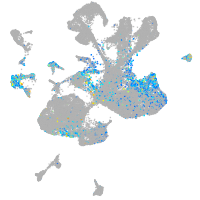
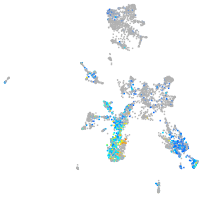
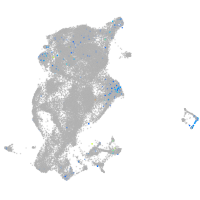
Expression by stage/cluster
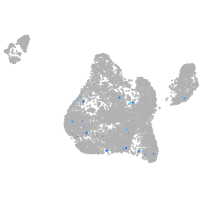
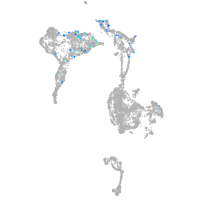
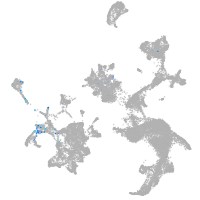
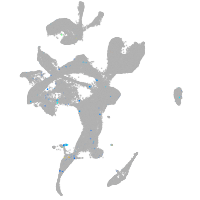
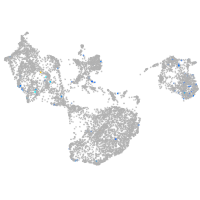
Correlated gene expression
Positive correlation
Negative correlation
Gene
r
Gene
r
c18h15orf65
0.436
and2
-0.050
wdr78
0.418
postnb
-0.047
ccdc175
0.411
aqp3a
-0.047
LOC108181470
0.409
gapdhs
-0.046
si:dkey-163f12.6
0.397
itgb1b.2
-0.043
si:ch73-174h16.5
0.376
actb2
-0.042
hydin
0.374
tmsb4x
-0.041
BX248410.3
0.359
sparc
-0.041
LOC101884649
0.352
rbp4
-0.040
pih1d2
0.350
zgc:86896
-0.039
tbata
0.339
si:ch73-1a9.3
-0.039
iqcg
0.332
col28a2a
-0.038
ppp1r42
0.323
ecrg4b
-0.038
cfap58
0.321
itgav
-0.038
lrriq1
0.313
hpdb
-0.037
dthd1
0.311
itgb4
-0.037
CR759887.3
0.311
krt91
-0.036
spata18
0.296
cotl1
-0.036
fam228a
0.295
pfn1
-0.035
xrra1
0.272
col17a1a
-0.035
slc25a29
0.259
mdka
-0.035
si:dkey-114c15.5
0.257
kera
-0.034
CABZ01040054.1
0.257
scinla
-0.033
whrna
0.250
krtt1c19e
-0.033
CABZ01069436.1
0.238
cebpb
-0.032
CABZ01073736.1
0.214
itga6b
-0.032
zmp:0000000650
0.210
ak1
-0.032
si:dkey-269i1.4
0.207
efhd2
-0.032
cyp11c1
0.201
col5a3b
-0.032
LOC108183290
0.196
pls3
-0.032
si:dkey-11c5.11
0.191
lum
-0.031
LOC108180091
0.187
padi2
-0.031
LOC101882910
0.183
col11a1a
-0.031
FP565432.1
0.179
si:dkey-16p21.8
-0.031
dnah11
0.173
col7a1
-0.031