Daniocell
rasa1b (endoderm)
RAS p21 protein activator (GTPase activating protein) 1b
ZFIN
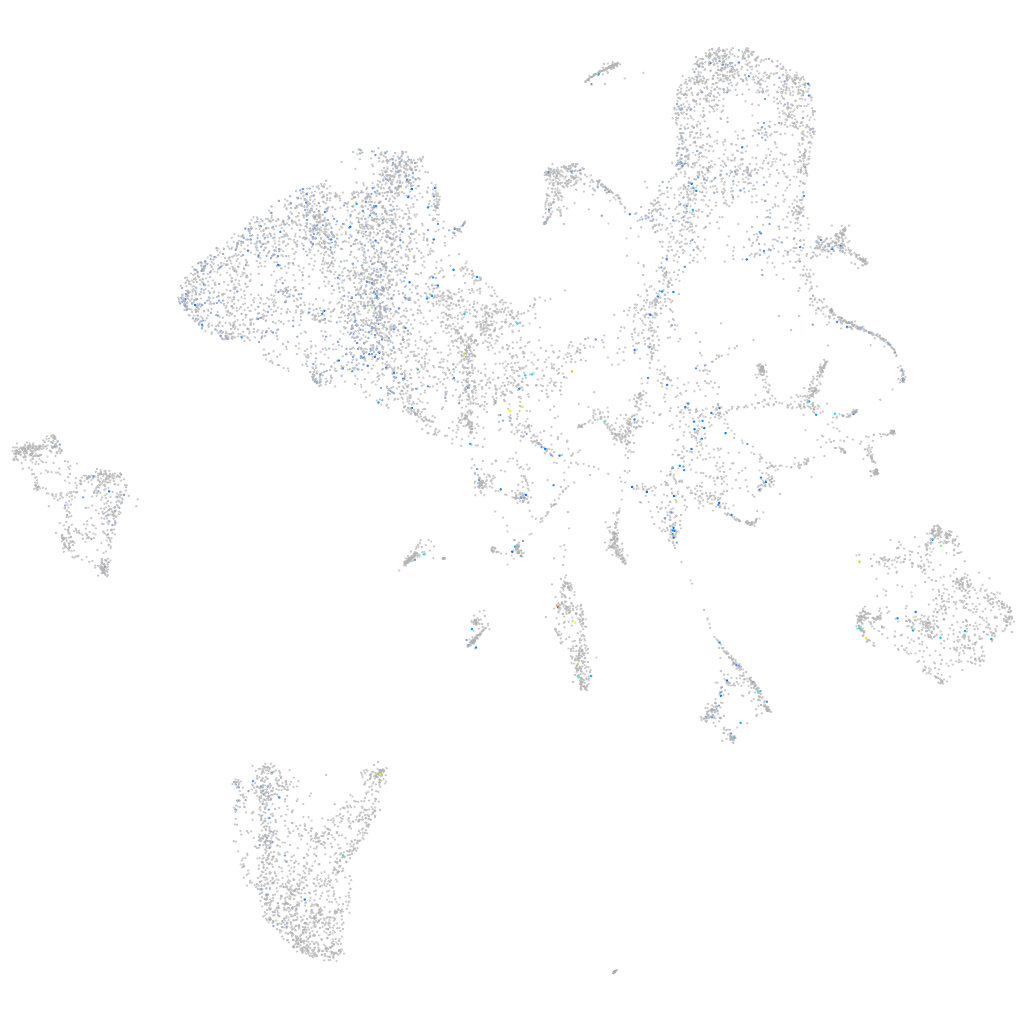
Gene expression UMAP
Display:
Expression
Stage
Other cell groups
all cells
blastomeres
PGCs
endoderm
axial mesoderm
muscle
mural cells /
non-skeletal muscle
mesenchyme
hematopoietic /
vasculature
pronephros
neural
spinal cord / glia
eye
taste / olfactory
otic / lateral line
epidermis
periderm
fin
ionocytes / mucous
pigment cells
Expression by stage/cluster
Correlated gene expression
Positive correlation
Negative correlation
Gene
r
Gene
r
lix1
0.188
si:ch211-195b11.3
-0.055
scamp5b
0.140
spink4
-0.053
pimr197
0.133
ela2l
-0.051
mir457b
0.126
prss59.2
-0.050
cax2
0.125
ela3l
-0.050
BX323994.2
0.124
prss59.1
-0.049
LOC101883921
0.118
amy2a
-0.049
BX324132.3
0.116
zgc:136461
-0.048
si:ch211-282j17.12
0.114
prss1
-0.048
itgb3a
0.113
cpb1
-0.048
LOC100331404
0.106
sycn.2
-0.048
LOC101884462
0.104
ctrb1
-0.048
XLOC-007245
0.103
pla2g1b
-0.048
LOC101886261
0.101
cpa5
-0.047
sox14
0.096
zgc:112160
-0.047
slc47a4
0.094
ela2
-0.046
AL954703.1
0.094
CELA1 (1 of many)
-0.046
wasf1
0.092
cpa4
-0.046
si:dkey-7j22.4
0.090
c6ast4
-0.046
CR450848.1
0.088
zgc:92137
-0.046
fn1b
0.086
pdia2
-0.045
cngb3.1
0.086
si:dkey-14d8.6
-0.045
BX901907.4
0.086
ctrl
-0.045
si:dkeyp-44a8.4
0.084
cpa1
-0.045
c1qtnf4
0.083
apoda.2
-0.044
CR550307.1
0.082
cel.1
-0.043
LOC103910250
0.082
cel.2
-0.043
hp
0.082
erp27
-0.043
acaa2
0.082
fep15
-0.043
banp
0.081
endou
-0.042
XLOC-008680
0.081
si:ch211-240l19.5
-0.042
tnfa
0.080
c6ast3
-0.040
BX663605.1
0.080
tmed6
-0.040
akt2l
0.079
si:dkey-14d8.7
-0.040
adamts13
0.078
si:ch211-240l19.6
-0.039