Daniocell
rasa1b (fin)
RAS p21 protein activator (GTPase activating protein) 1b
ZFIN
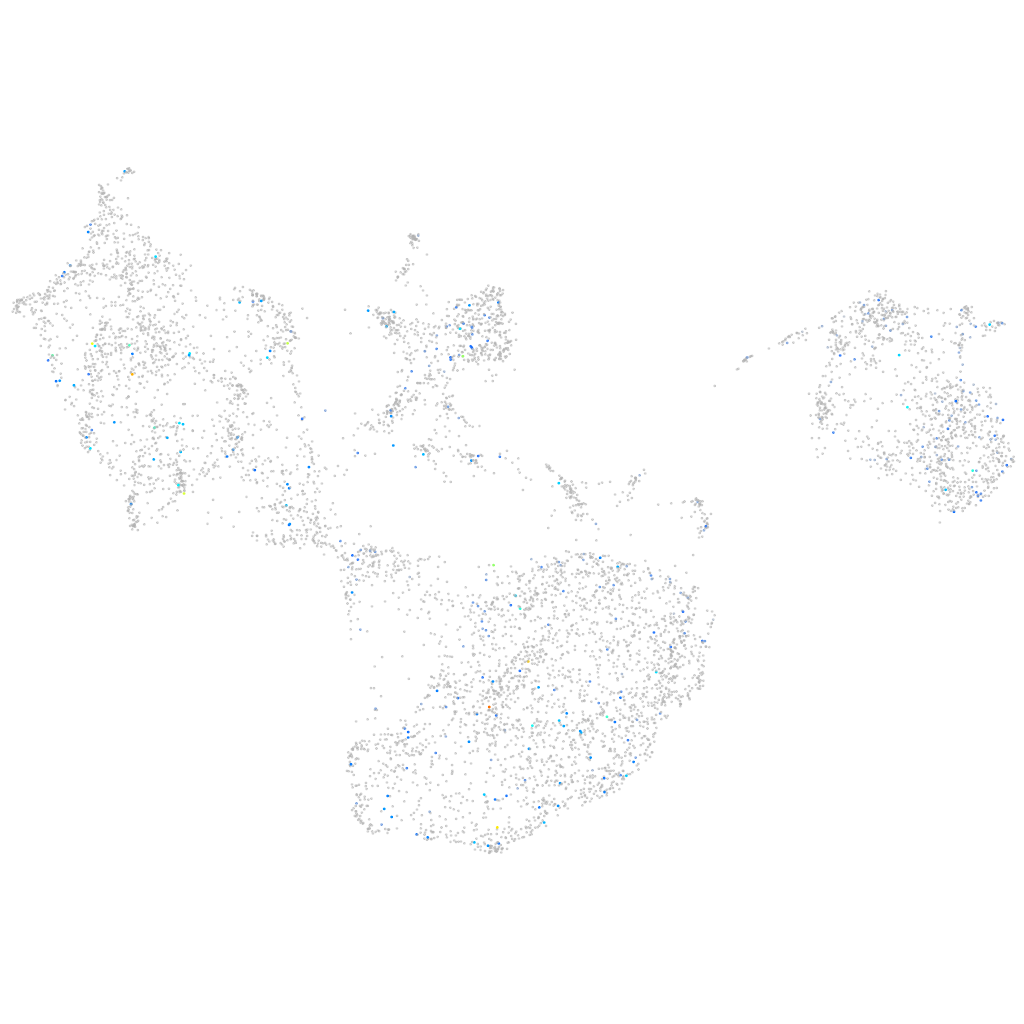
Gene expression UMAP
Display:
Expression
Stage
Other cell groups
all cells
blastomeres
PGCs
endoderm
axial mesoderm
muscle
mural cells /
non-skeletal muscle
mesenchyme
hematopoietic /
vasculature
pronephros
neural
spinal cord / glia
eye
taste / olfactory
otic / lateral line
epidermis
periderm
fin
ionocytes / mucous
pigment cells
Expression by stage/cluster
Correlated gene expression
Positive correlation
Negative correlation
Gene
r
Gene
r
LOC100534851
0.168
fbp1a
-0.034
CR450686.3
0.141
si:dkey-12l12.1
-0.031
XLOC-044140
0.131
cd2bp2
-0.029
BX914205.2
0.130
pelo
-0.028
AL954767.1
0.129
kctd6b
-0.027
LOC108183311
0.129
sdhc
-0.026
FP102892.1
0.124
cdk8
-0.026
AL935184.2
0.122
hprt1
-0.025
si:dkey-188i13.9
0.121
hnrnpua
-0.025
XLOC-017492
0.118
galnt7
-0.025
LOC110439832
0.118
ackr4b
-0.024
CU469420.4
0.117
utp6
-0.024
CR925803.1
0.116
klc4
-0.024
XLOC-035162
0.115
qdpra
-0.024
AL935195.1
0.115
st3gal8
-0.023
si:dkey-266f7.5
0.113
cox20
-0.023
si:dkey-84h14.2
0.108
uxt
-0.023
ccdc62
0.105
atp1b3b
-0.023
rasgrp2
0.105
trpm4b.2
-0.023
CR450780.3
0.102
ccdc174
-0.023
si:ch211-246e12.3
0.102
arfrp1
-0.023
tmem86b
0.098
slc4a2b
-0.023
epor
0.098
timm8a
-0.023
adipoqa
0.098
si:ch211-241b2.1
-0.023
CR855860.2
0.097
zgc:162858
-0.023
BX072559.1
0.097
mark2a
-0.023
mir30a
0.096
thg1l
-0.023
cryaba
0.095
si:dkeyp-75h12.5
-0.023
krt18a.2
0.094
nf2b
-0.022
pcdh2g9
0.094
psme3
-0.022
heg1
0.094
rpn2
-0.022
BX119902.2
0.092
dpf2
-0.022
BX649295.2
0.091
pa2g4b
-0.022
LOC101882592
0.091
dirc2
-0.022
spam1
0.091
ptpmt1
-0.022