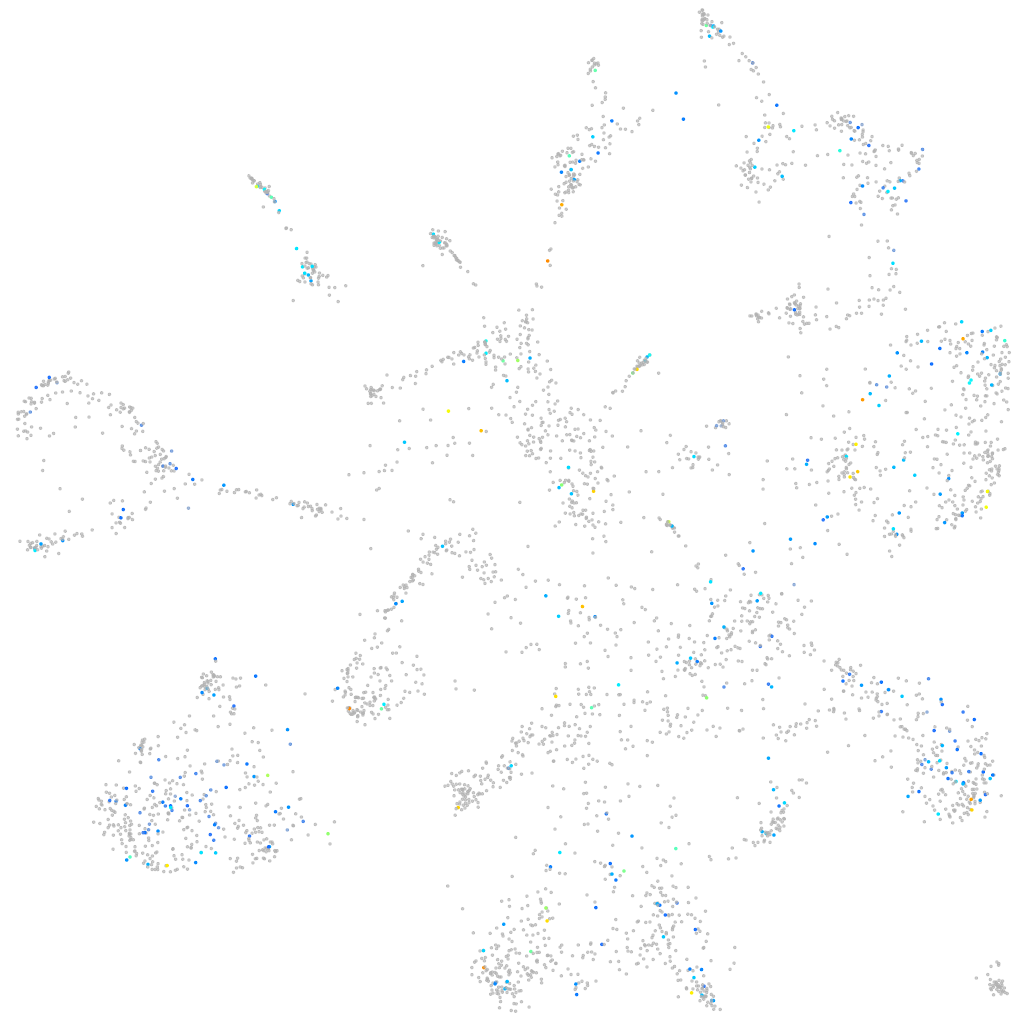
Daniocell
ptpra (mural cells / non-skeletal muscle)
protein tyrosine phosphatase receptor type A
ZFIN
Gene expression UMAP
Display:
Expression
Stage
Other cell groups
all cells
blastomeres
PGCs
endoderm
axial mesoderm
muscle
mural cells /
non-skeletal muscle
mesenchyme
hematopoietic /
vasculature
pronephros
neural
spinal cord / glia
eye
taste / olfactory
otic / lateral line
epidermis
periderm
fin
ionocytes / mucous
pigment cells
Expression by stage/cluster
Correlated gene expression
Positive correlation
Negative correlation
Gene
r
Gene
r
vwf
0.130
rpl12
-0.060
CABZ01101984.1
0.129
rpl24
-0.053
XLOC-014488
0.128
myl9a
-0.051
CR388132.1
0.125
rpl27
-0.050
si:ch73-252i11.1
0.120
rpl10a
-0.050
RF01192
0.118
rpl35a
-0.049
proser2
0.117
cacybp
-0.049
ptger2a
0.112
eno3
-0.048
or137-3
0.106
ptmaa
-0.047
si:dkeyp-44b5.4
0.105
sirt5
-0.046
crygm2d10
0.105
rplp1
-0.046
XLOC-012926
0.104
krt91
-0.044
CT025771.1
0.104
rps21
-0.044
LOC110439892
0.104
rps26
-0.043
LOC110438146
0.104
ndufb8
-0.043
LOC110439257
0.103
nme2b.1
-0.043
abca4b
0.101
meis2b
-0.042
cyp11c1
0.100
rpl22
-0.042
FP102192.2
0.098
pgp
-0.042
LOC108190590
0.095
ccdc115
-0.041
si:ch211-93f2.1
0.093
aldob
-0.041
XLOC-002665
0.093
gpia
-0.041
drd5a
0.093
rpl21
-0.040
zgc:171929
0.092
fhl2a
-0.039
znf1067
0.092
CR318588.3
-0.039
mdh1b
0.092
fbp2
-0.039
BX664618.1
0.091
tnni2a.4
-0.039
si:dkey-51d8.1
0.091
jdp2b
-0.038
lrig3.2
0.091
rpl39
-0.038
tmprss9
0.090
rps19
-0.038
sptbn5
0.090
pcnp
-0.038
si:dkey-109a10.2
0.089
rpl29
-0.038
XLOC-043113
0.089
mylpfa
-0.038
ints5
0.088
XLOC-035413
-0.037
XLOC-024390
0.087
emilin2a
-0.037