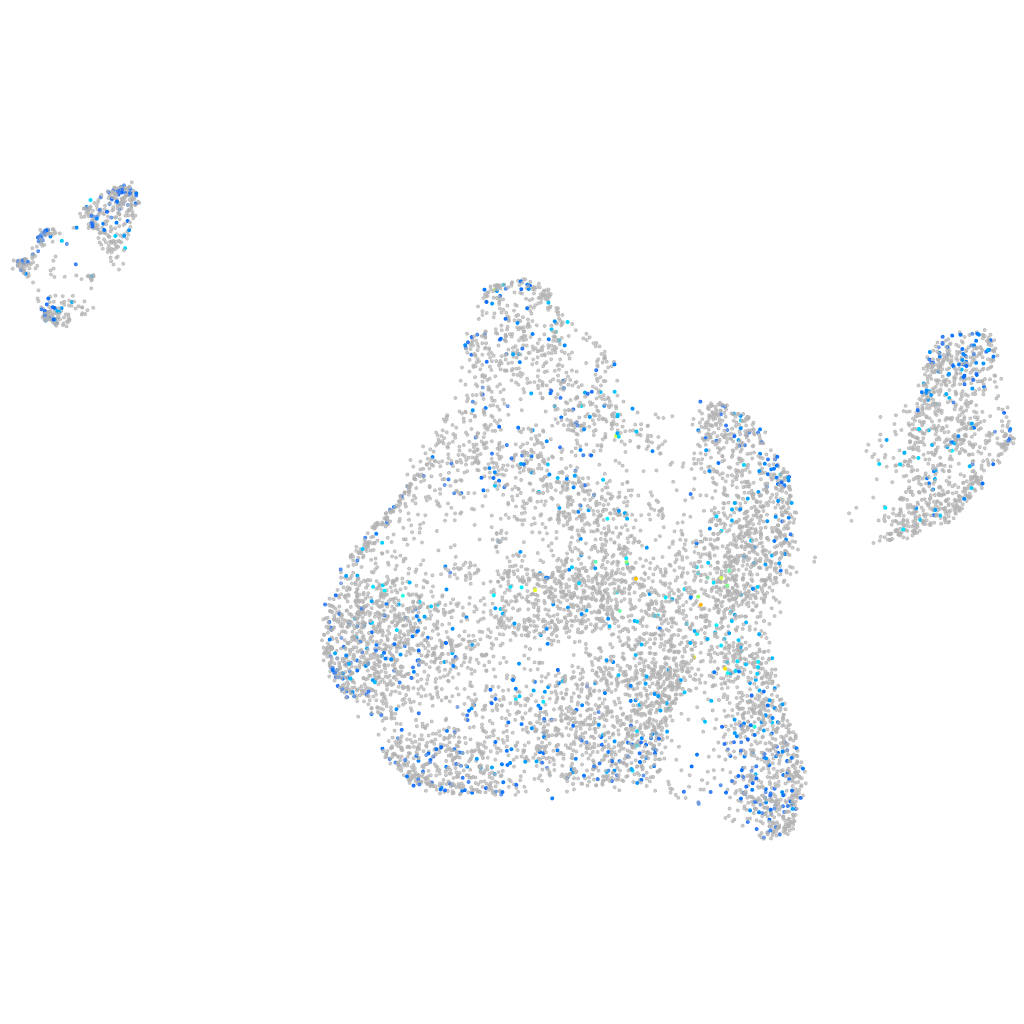
Daniocell
ptpra (blastomeres)
protein tyrosine phosphatase receptor type A
ZFIN
Gene expression UMAP
Display:
Expression
Stage
Other cell groups
all cells
blastomeres
PGCs
endoderm
axial mesoderm
muscle
mural cells /
non-skeletal muscle
mesenchyme
hematopoietic /
vasculature
pronephros
neural
spinal cord / glia
eye
taste / olfactory
otic / lateral line
epidermis
periderm
fin
ionocytes / mucous
pigment cells
Expression by stage/cluster
Correlated gene expression
Positive correlation
Negative correlation
Gene
r
Gene
r
LOC108183378
0.072
hmgn2
-0.045
si:ch211-271g18.1
0.072
dynll1
-0.043
LOC110437802
0.067
eef1a1l1
-0.041
si:dkeyp-82a1.8
0.066
rps2
-0.041
scn8aa
0.065
rbm4.3
-0.041
tor4ab
0.065
marcksl1b
-0.040
CR762420.1
0.064
hspb1
-0.040
LOC108191695
0.064
hnrnpa0b
-0.038
BX908756.1
0.063
rpl7a
-0.038
si:ch211-64i20.3
0.061
rpl7
-0.037
ddr2a
0.061
h2afvb
-0.037
si:ch211-193l2.6
0.061
rps18
-0.037
vsnl1b
0.061
rpl19
-0.036
pimr110
0.061
rps5
-0.036
si:dkey-23a13.2
0.059
si:ch73-1a9.3
-0.035
snx10a
0.058
khdrbs1a
-0.035
mad1l1
0.057
NC-002333.4
-0.034
LOC108181454
0.056
aldob
-0.034
XLOC-021400
0.056
srsf5a
-0.033
CR388129.1
0.056
si:ch211-152c2.3
-0.033
si:ch211-132b12.8
0.056
hmga1a
-0.033
LOC108182577
0.056
lsm8
-0.033
ell
0.055
bub3
-0.032
XLOC-000597
0.054
rps7
-0.032
BX511246.1
0.054
cirbpb
-0.032
hspa5
0.053
hmgn6
-0.032
CU019562.3
0.053
tbxta
-0.031
vps9d1
0.053
CR383676.1
-0.031
BX548060.1
0.052
hnrnpa0a
-0.031
npr1a
0.052
LOC101886485
-0.031
ftr85
0.052
rps12
-0.031
eloal
0.052
rps15a
-0.030
hcn1
0.052
rps20
-0.030
plch2b
0.052
rps27a
-0.030
kif20ba
0.051
spcs1
-0.030