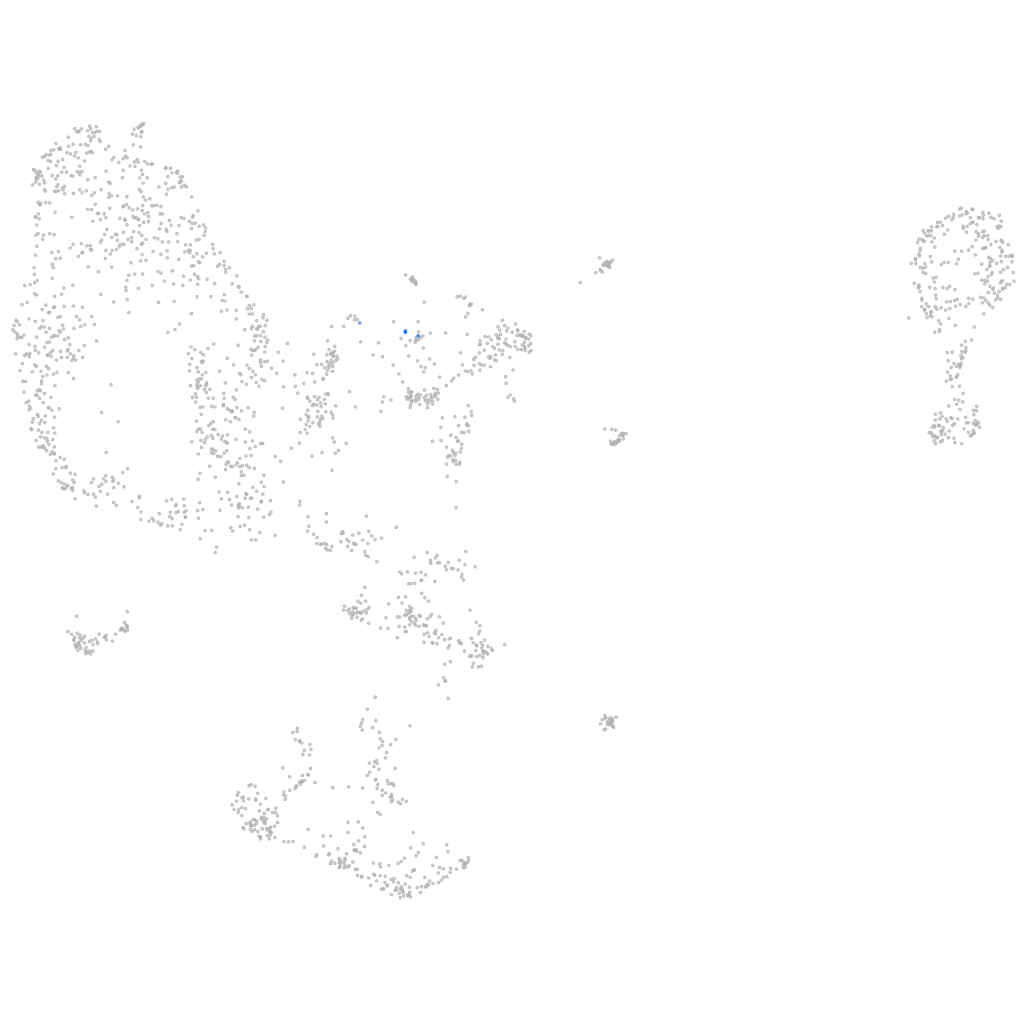
Daniocell
pear1 (pronephros)
platelet endothelial aggregation receptor 1
ZFIN
Gene expression UMAP
Display:
Expression
Stage
Other cell groups
all cells
blastomeres
PGCs
endoderm
axial mesoderm
muscle
mural cells /
non-skeletal muscle
mesenchyme
hematopoietic /
vasculature
pronephros
neural
spinal cord / glia
eye
taste / olfactory
otic / lateral line
epidermis
periderm
fin
ionocytes / mucous
pigment cells
Expression by stage/cluster
Correlated gene expression
Positive correlation
Negative correlation
Gene
r
Gene
r
BX897741.1
0.663
ppp2cb
-0.040
LOC110439340
0.663
si:ch211-222l21.1
-0.038
GNG4
0.532
psma4
-0.037
CR788235.1
0.532
sf3b5
-0.035
LOC108184024
0.532
cldn7b
-0.035
XLOC-037878
0.532
timm10
-0.034
LOC108192080
0.532
sf3b2
-0.033
pimr132
0.532
cycsb
-0.032
XLOC-017188
0.527
nfyc
-0.032
LOC103910220
0.500
srp19
-0.032
si:ch211-252f13.5
0.494
calm3b
-0.031
LOC108191351
0.486
cldnc
-0.031
celsr3
0.453
mrps34
-0.030
fgf7
0.448
ywhaqb
-0.030
grem1b
0.405
cldnh
-0.030
si:dkeyp-110c12.3
0.400
ubxn1
-0.030
hoxa1a
0.388
cd9b
-0.029
zgc:136963
0.388
seta
-0.029
glt8d2
0.379
tomm22
-0.029
si:ch211-287a12.9
0.376
morf4l1
-0.029
CABZ01060891.1
0.340
lsm12b
-0.029
LOC108179520
0.340
sub1a
-0.029
CABZ01075114.1
0.340
selenot2
-0.029
LO018508.1
0.340
nedd8
-0.028
plxnd1
0.340
psmc3
-0.028
znf1082
0.340
setb
-0.028
CU463231.2
0.340
aimp1
-0.028
taar20c
0.340
tomm40l
-0.028
si:dkey-256e7.8
0.324
pax8
-0.027
avpr1ab
0.317
vaspb
-0.027
adra1aa
0.300
txnipa
-0.027
dkk2
0.295
prps1a
-0.027
nfatc4
0.293
mrpl24
-0.027
znf1016
0.292
hp1bp3
-0.027
BX936391.1
0.290
metap2b
-0.027