Daniocell
pear1 (taste / olfactory)
platelet endothelial aggregation receptor 1
ZFIN
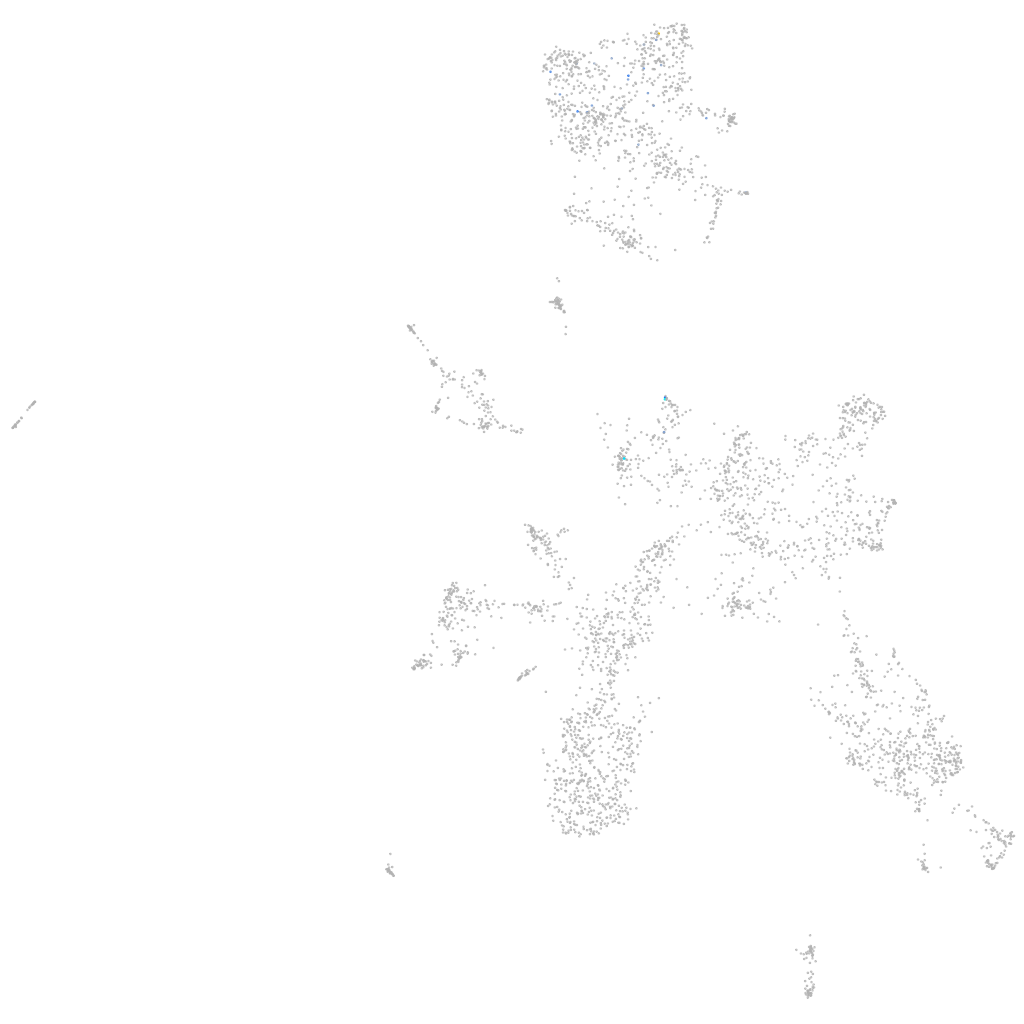
Gene expression UMAP
Display:
Expression
Stage
Other cell groups
all cells
blastomeres
PGCs
endoderm
axial mesoderm
muscle
mural cells /
non-skeletal muscle
mesenchyme
hematopoietic /
vasculature
pronephros
neural
spinal cord / glia
eye
taste / olfactory
otic / lateral line
epidermis
periderm
fin
ionocytes / mucous
pigment cells
Expression by stage/cluster
Correlated gene expression
Positive correlation
Negative correlation
Gene
r
Gene
r
si:ch211-154e10.1
0.627
ptmaa
-0.058
si:ch73-166o21.1
0.442
mt-co1
-0.047
lingo1b
0.383
COX5B
-0.046
BX901898.1
0.378
tspan2a
-0.043
zgc:112146
0.355
mycbp
-0.042
XLOC-029420
0.329
insm1a
-0.042
LOC110440146
0.328
pvalb5
-0.042
tfeb
0.326
spcs2
-0.041
pcolce2a
0.325
selenot1a
-0.040
CU928131.1
0.304
zgc:55461
-0.040
CR786582.2
0.296
dynll1
-0.040
CABZ01078733.1
0.291
ywhae1
-0.039
LOC100151603
0.283
zgc:65894
-0.038
CU024870.1
0.265
adcyap1b
-0.038
tmod1
0.255
atf5a
-0.038
ampd1
0.254
gnb1a
-0.038
pcdh1g1
0.253
NC-002333.4
-0.037
chrnb4
0.235
anp32a
-0.037
itgb2
0.231
chga
-0.036
cdc42ep1a
0.224
elavl3
-0.036
prcp
0.222
LOC100537342
-0.036
cel.1
0.218
apex1
-0.036
ldlra
0.208
si:ch211-153b23.5
-0.036
abcg4b
0.206
scg2b
-0.036
LOC101887114
0.202
tmsb
-0.035
XLOC-031073
0.201
mpc2
-0.035
si:dkey-28o19.1
0.197
fthl31
-0.034
satb2
0.196
cox8a
-0.034
tpcn2
0.194
fstl5
-0.034
si:ch211-195o20.7
0.190
msi2b
-0.034
si:dkey-171c9.3
0.186
gng13b
-0.034
lhx8a
0.185
insm1b
-0.033
BX640537.3
0.181
map1b
-0.033
abcb6a
0.181
ncl
-0.033
hoxa2b
0.181
capsla
-0.033