Daniocell
pcolce2a (epidermis)
procollagen C-endopeptidase enhancer 2a
ZFIN
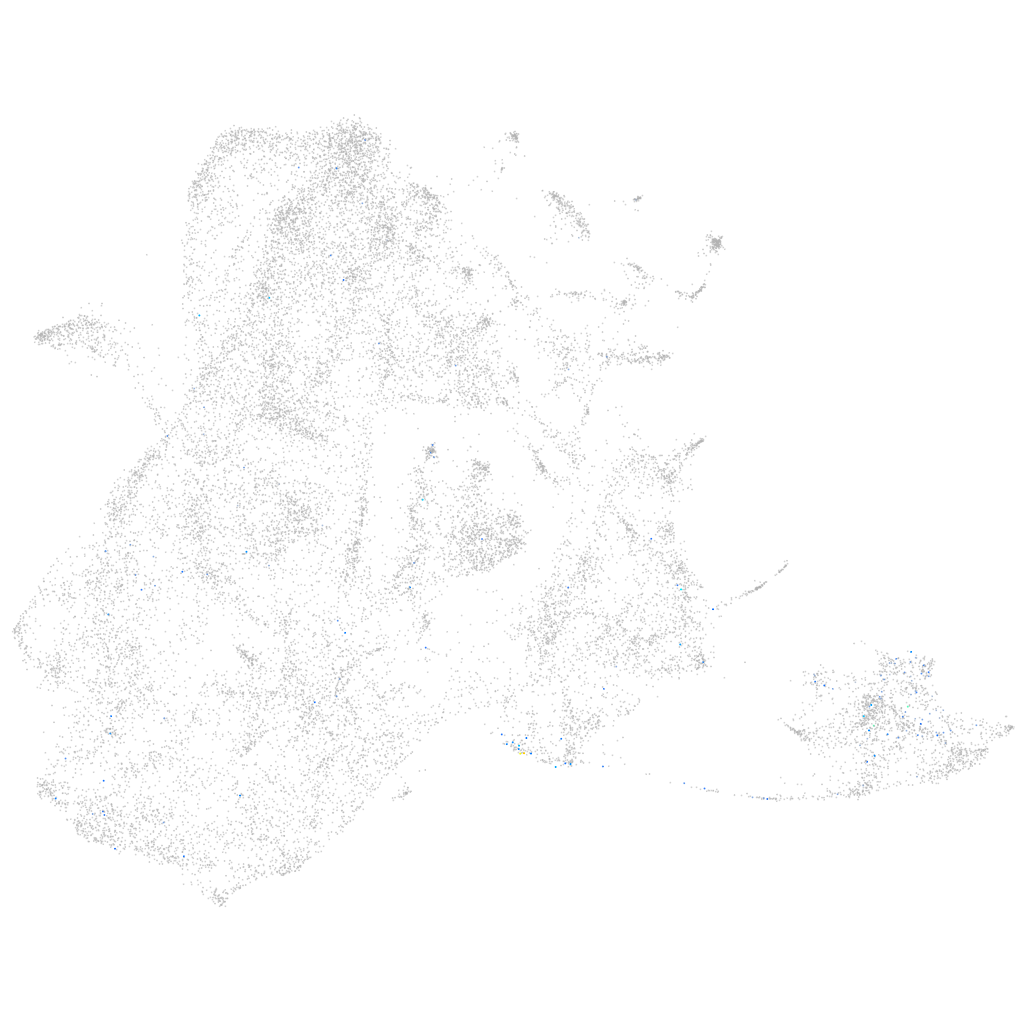
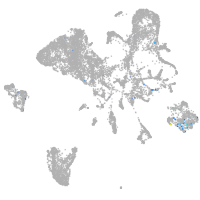
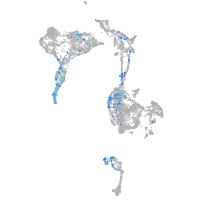
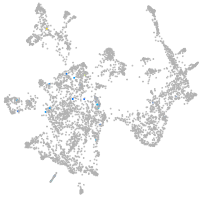
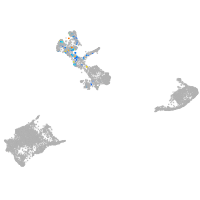
Gene expression UMAP
Display:
Expression
Stage
Other cell groups
all cells
blastomeres
PGCs
endoderm
axial mesoderm
muscle
mural cells /
non-skeletal muscle
mesenchyme
hematopoietic /
vasculature
pronephros
neural
spinal cord / glia
eye
taste / olfactory
otic / lateral line
epidermis
periderm
fin
ionocytes / mucous
pigment cells
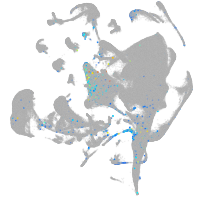
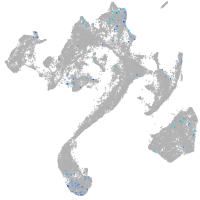
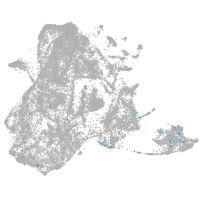
Expression by stage/cluster
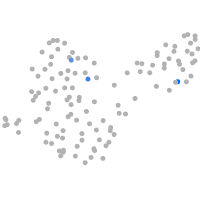
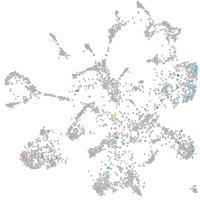
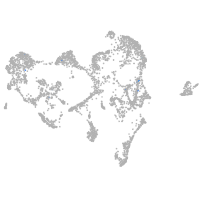
Correlated gene expression
Positive correlation
Negative correlation
Gene
r
Gene
r
BX899181.1
0.152
tmsb4x
-0.059
CU855917.1
0.145
pfn1
-0.058
taar14b
0.144
cldn1
-0.052
or131-2
0.127
si:dkey-16p21.8
-0.049
si:ch211-156j16.1
0.112
cldni
-0.047
XLOC-041707
0.103
col1a2
-0.047
CABZ01100396.1
0.103
sparc
-0.047
CABZ01045212.1
0.103
ecrg4b
-0.047
si:ch211-193i15.2
0.099
zgc:86896
-0.045
BX927234.1
0.097
postnb
-0.044
CU929322.1
0.094
cfl1l
-0.043
pltp
0.092
krt5
-0.043
ponzr5
0.090
cotl1
-0.041
CABZ01034082.1
0.088
col1a1b
-0.041
XLOC-036624
0.085
cyt1l
-0.040
CU570976.1
0.084
krtt1c19e
-0.040
trim108
0.084
spaca4l
-0.039
CABZ01058107.1
0.084
rbp4
-0.038
krt1-19d
0.084
col1a1a
-0.038
dpt
0.083
zgc:101810
-0.038
cyth4b
0.081
si:dkey-33c14.3
-0.038
si:ch211-157c3.4
0.081
col2a1b
-0.038
nme4
0.081
lgals1l1
-0.037
LOC103911208
0.080
wu:fa03e10
-0.037
ihha
0.080
itgb1b.1
-0.037
dhrs13a.2
0.080
col11a1a
-0.036
ftr86
0.079
myh9a
-0.036
evplb
0.078
actb2
-0.034
LOC101883563
0.078
zgc:136930
-0.034
si:dkey-33m11.7
0.077
arpc5b
-0.034
cldn23b
0.077
col18a1a
-0.033
LOC103911968
0.076
thy1
-0.033
si:ch73-204p21.2
0.075
ptmaa
-0.032
si:dkeyp-23e4.3
0.075
si:dkey-183i3.5
-0.032
BX005286.1
0.075
cxl34b.11
-0.032