
pantothenate kinase 1b
ZFIN 
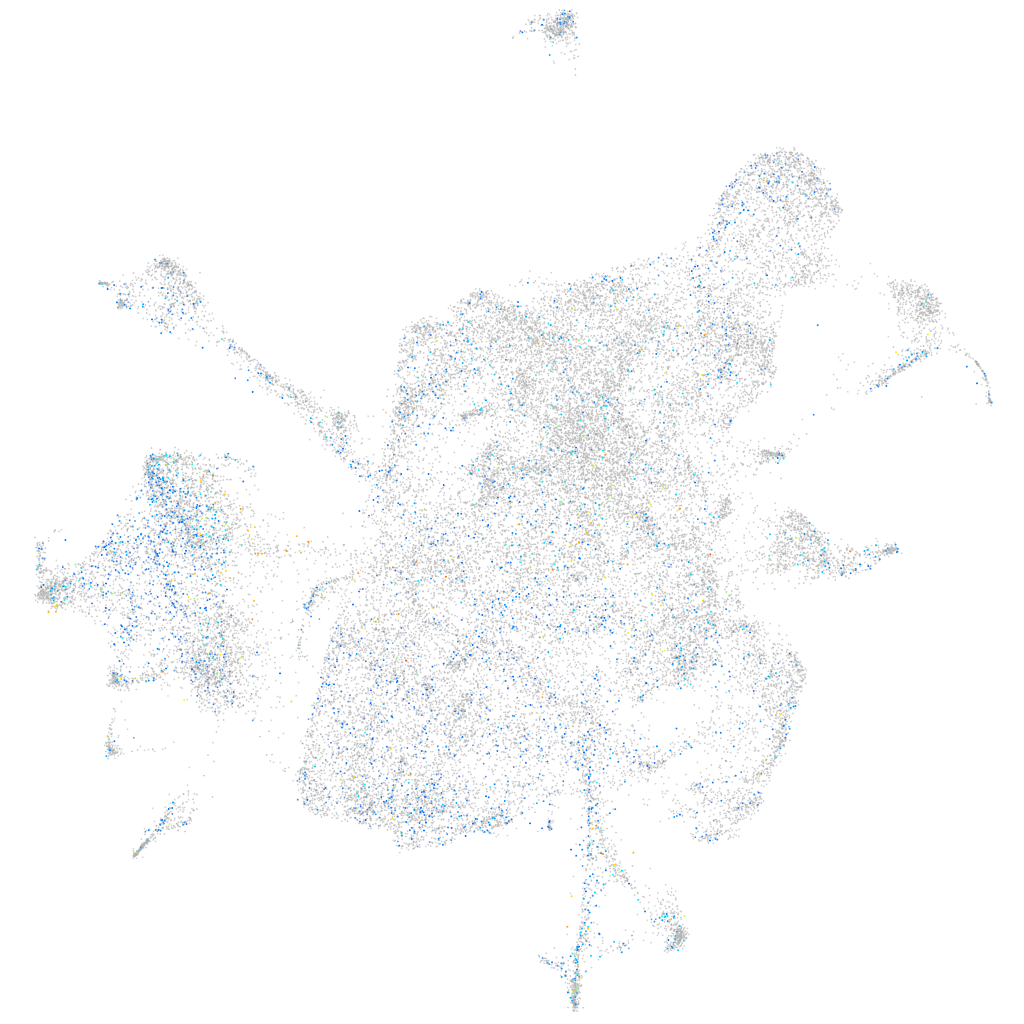
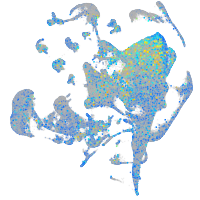
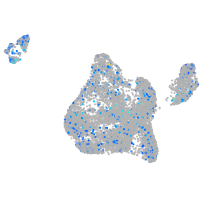
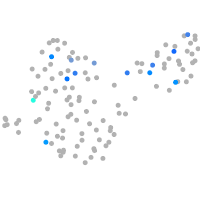
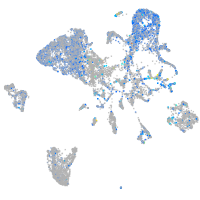
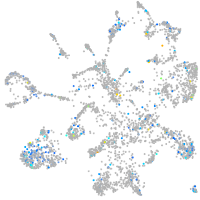
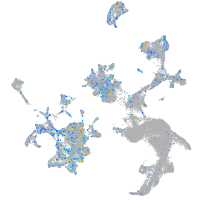
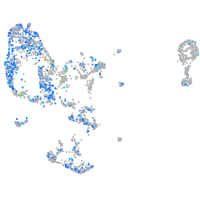
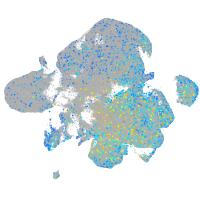
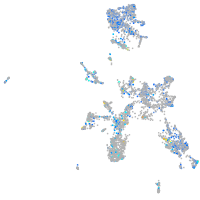
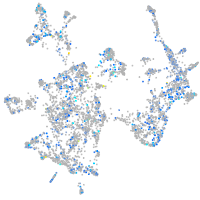
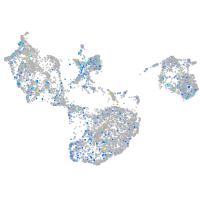
Gene expression UMAP


Expression by stage/cluster
Correlated gene expression
| Positive correlation | Negative correlation | ||
| Gene | r | Gene | r |
| tuba1c | 0.096 | rps2 | -0.057 |
| rtn1a | 0.092 | rplp1 | -0.057 |
| stmn1b | 0.090 | rpl26 | -0.053 |
| gpm6aa | 0.090 | rps27a | -0.053 |
| ckbb | 0.089 | rps14 | -0.050 |
| gng3 | 0.089 | rps23 | -0.047 |
| nova2 | 0.088 | rpl39 | -0.045 |
| elavl3 | 0.087 | rpl10 | -0.044 |
| myt1b | 0.083 | rpl23 | -0.044 |
| elavl4 | 0.082 | rps19 | -0.044 |
| sncb | 0.081 | rpl7 | -0.044 |
| rtn1b | 0.081 | rps7 | -0.044 |
| tuba1a | 0.081 | si:dkey-151g10.6 | -0.043 |
| tubb5 | 0.081 | rpl10a | -0.043 |
| stxbp1a | 0.080 | rpl36a | -0.043 |
| stmn2a | 0.079 | aldob | -0.042 |
| mllt11 | 0.079 | rps15a | -0.041 |
| cspg5a | 0.079 | rpl8 | -0.041 |
| adam22 | 0.079 | rpl13 | -0.041 |
| gpm6ab | 0.078 | rps4x | -0.041 |
| ywhag2 | 0.078 | rpl37 | -0.040 |
| vamp2 | 0.078 | rps3a | -0.040 |
| myt1a | 0.077 | rpl18 | -0.039 |
| rnasekb | 0.076 | rps26l | -0.039 |
| zgc:65894 | 0.076 | rpl35a | -0.039 |
| ppp1r14ba | 0.075 | rps24 | -0.039 |
| stx1b | 0.075 | rpl11 | -0.039 |
| tmsb | 0.074 | rpl13a | -0.038 |
| gap43 | 0.074 | rpl19 | -0.038 |
| marcksl1b | 0.074 | rps25 | -0.037 |
| syt1a | 0.074 | rps15 | -0.037 |
| atp6v0cb | 0.074 | rps27.1 | -0.037 |
| si:dkey-56m19.5 | 0.073 | rps9 | -0.036 |
| ywhah | 0.072 | rps20 | -0.036 |
| tmsb2 | 0.071 | eef1a1l1 | -0.036 |