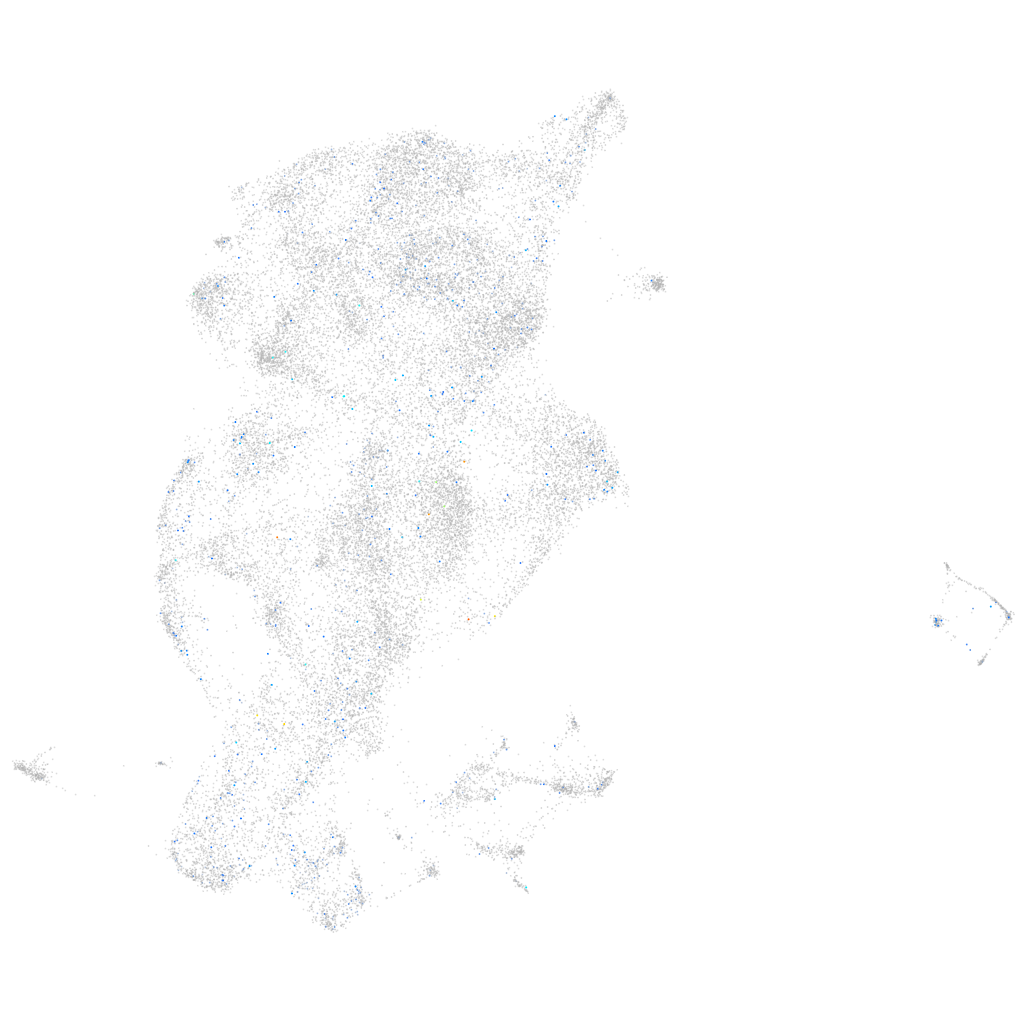
Daniocell
oscp1a (periderm)
organic solute carrier partner 1a
ZFIN
Gene expression UMAP
Display:
Expression
Stage
Other cell groups
all cells
blastomeres
PGCs
endoderm
axial mesoderm
muscle
mural cells /
non-skeletal muscle
mesenchyme
hematopoietic /
vasculature
pronephros
neural
spinal cord / glia
eye
taste / olfactory
otic / lateral line
epidermis
periderm
fin
ionocytes / mucous
pigment cells
Expression by stage/cluster
Correlated gene expression
Positive correlation
Negative correlation
Gene
r
Gene
r
or126-1
0.103
pvalb1
-0.031
LOC100003040
0.089
pvalb2
-0.028
avpr2aa
0.081
selenow1
-0.028
LOC103911255
0.073
CABZ01072614.1
-0.027
BX005245.1
0.071
rplp2
-0.027
col8a2
0.060
LOC110439372
-0.027
BX927394.2
0.059
cyt1l
-0.025
CR381684.1
0.059
mt-co2
-0.025
vwa2
0.059
si:dkeyp-51b9.3
-0.024
hcrt
0.058
sec23b
-0.024
BX927374.1
0.055
rpl6
-0.024
XLOC-008602
0.055
zgc:158463
-0.023
si:dkey-1m11.6
0.053
mt-co1
-0.023
XLOC-042200
0.053
b2ml
-0.022
LOC101882407
0.052
mt-atp6
-0.022
XLOC-035744
0.051
mt-nd1
-0.022
lrrc3b
0.051
prss1
-0.021
CR394546.5
0.050
actc1b
-0.021
klhl7
0.050
myhz1.1
-0.021
slitrk4
0.050
rpl3
-0.020
LOC100006895
0.050
krt15
-0.020
slco1c1
0.049
cyldb
-0.020
drd6b
0.049
mark2b
-0.019
LOC100149007
0.049
CABZ01068248.1
-0.019
LOC110439321
0.047
CABZ01079276.1
-0.019
si:dkey-234i14.3
0.047
CABZ01039859.1
-0.019
sstr1b
0.047
icn2
-0.019
gsx2
0.047
tnni2a.4
-0.019
XLOC-042812
0.047
CU571315.2
-0.019
LOC101884463
0.047
mylz3
-0.019
CR352226.2
0.046
rpl27a
-0.018
rida.1
0.046
psmb12
-0.018
LOC110439449
0.045
apoa2
-0.018
CR318607.1
0.045
mt-nd4
-0.018
fam78bb
0.043
si:dkey-33c14.3
-0.018