Daniocell
oscp1a (epidermis)
organic solute carrier partner 1a
ZFIN
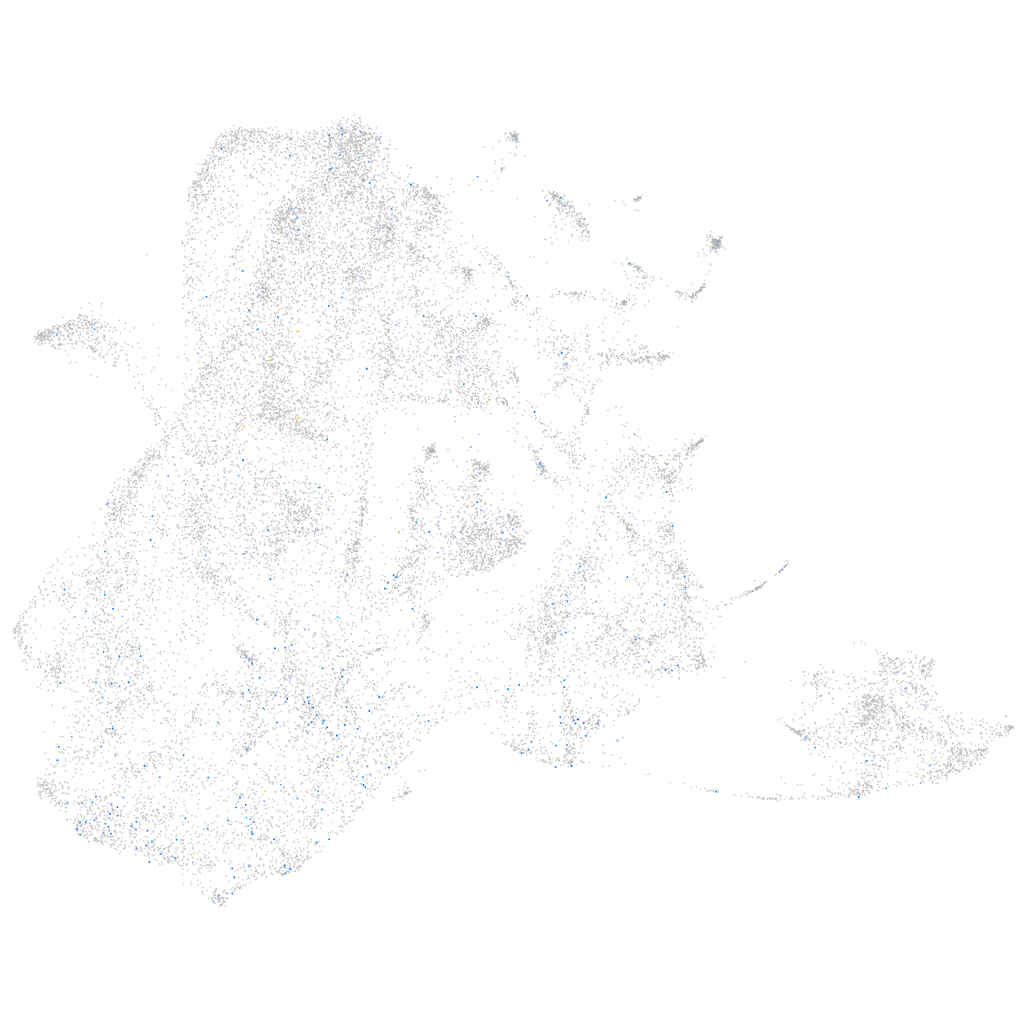
Gene expression UMAP
Display:
Expression
Stage
Other cell groups
all cells
blastomeres
PGCs
endoderm
axial mesoderm
muscle
mural cells /
non-skeletal muscle
mesenchyme
hematopoietic /
vasculature
pronephros
neural
spinal cord / glia
eye
taste / olfactory
otic / lateral line
epidermis
periderm
fin
ionocytes / mucous
pigment cells
Expression by stage/cluster
Correlated gene expression
Positive correlation
Negative correlation
Gene
r
Gene
r
XLOC-022924
0.115
eef1da
-0.048
CR792454.1
0.100
rplp2
-0.048
XLOC-004682
0.086
col1a2
-0.046
XLOC-013219
0.082
aqp3a
-0.045
CR932360.2
0.082
sparc
-0.045
hspb1
0.079
krt91
-0.045
XLOC-001600
0.077
cotl1
-0.044
LOC110439163
0.074
col1a1b
-0.044
zgc:113886
0.073
anxa1a
-0.044
slc5a12
0.073
tmsb1
-0.043
XLOC-043685
0.071
krtt1c19e
-0.042
XLOC-035272
0.071
si:dkey-16p21.8
-0.042
BX294379.1
0.070
capns1a
-0.041
si:dkey-14d8.22
0.067
col1a1a
-0.041
BX323038.1
0.065
col11a1a
-0.040
znf1079
0.065
cyt1l
-0.040
api5
0.065
krt4
-0.040
hes2.1
0.063
krt5
-0.040
anp32b
0.063
cldn1
-0.039
si:ch211-214j24.15
0.063
cavin2a
-0.039
si:ch73-281n10.2
0.063
gapdhs
-0.039
lsm5
0.063
s100a10b
-0.039
LOC110438335
0.063
plecb
-0.038
cbx3a
0.062
rbp4
-0.038
cx43.4
0.062
lamb4
-0.037
sept15
0.062
postnb
-0.036
XLOC-032526
0.062
itgb4
-0.036
hist1h2a3
0.062
rps29
-0.035
nop58
0.061
aep1
-0.035
XLOC-039121
0.061
rac2
-0.035
BX927258.1
0.061
ak1
-0.034
nono
0.060
zgc:85932
-0.034
sumo3b
0.060
itm2bb
-0.034
snrpc
0.060
si:dkey-33c14.3
-0.033
ddx61
0.060
col14a1b
-0.033