Daniocell
oscp1a (glial cells / spinal cord)
organic solute carrier partner 1a
ZFIN
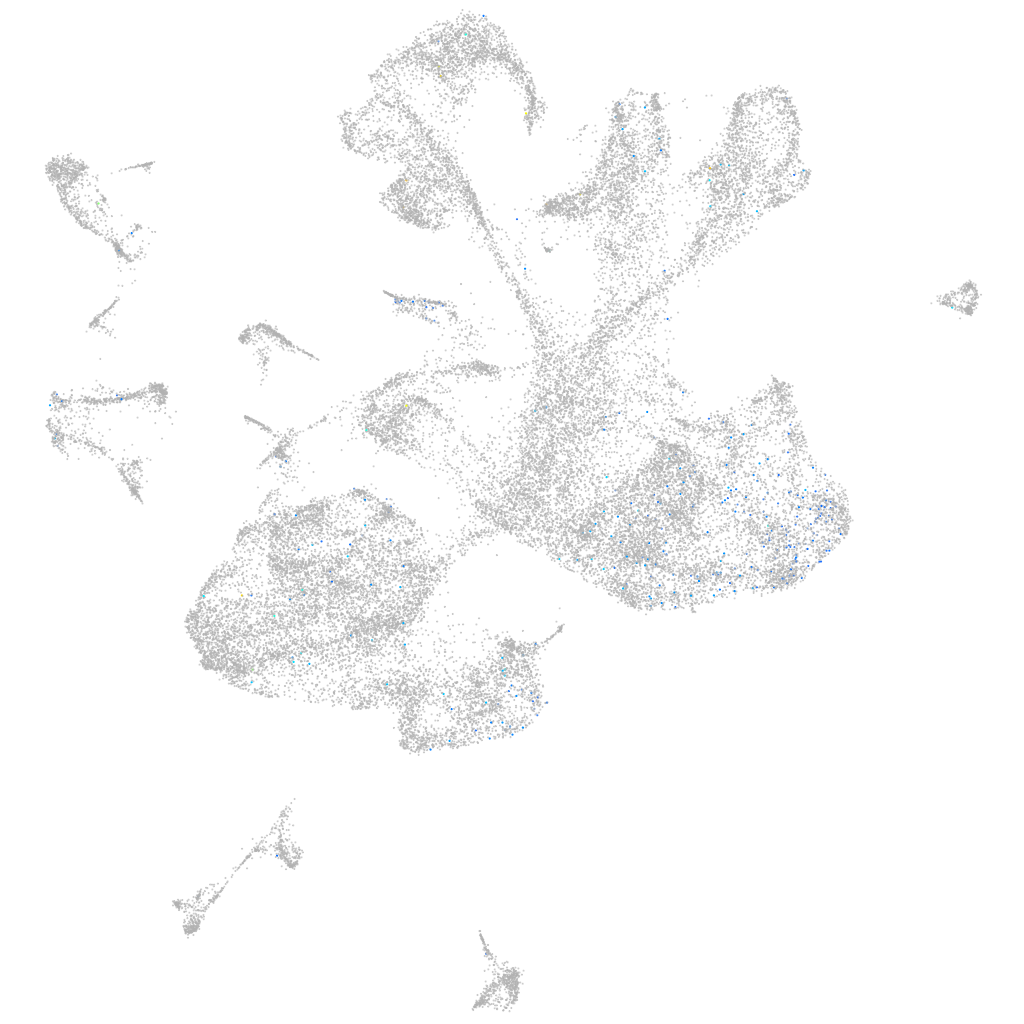
Gene expression UMAP
Display:
Expression
Stage
Other cell groups
all cells
blastomeres
PGCs
endoderm
axial mesoderm
muscle
mural cells /
non-skeletal muscle
mesenchyme
hematopoietic /
vasculature
pronephros
neural
spinal cord / glia
eye
taste / olfactory
otic / lateral line
epidermis
periderm
fin
ionocytes / mucous
pigment cells
Expression by stage/cluster
Correlated gene expression
Positive correlation
Negative correlation
Gene
r
Gene
r
RF00397
0.112
COX3
-0.039
sh2d1ab
0.110
ckbb
-0.038
LOC101884923
0.100
pvalb1
-0.035
SLC7A1
0.097
CU467822.1
-0.035
LOC103910003
0.091
gpm6aa
-0.032
XLOC-039966
0.089
CR383676.1
-0.030
CR376737.1
0.085
rtn1a
-0.030
vcam1a
0.083
tmsb
-0.030
znf1175
0.078
pvalb2
-0.030
si:ch73-24k9.2
0.075
dpysl2b
-0.029
CT030712.1
0.073
CU634008.1
-0.029
apip
0.072
agrn
-0.027
cdx4
0.072
vim
-0.027
LOC100535405
0.070
gpm6ab
-0.027
si:ch211-233m11.1
0.070
LOC101882472
-0.027
XLOC-026004
0.068
myt1b
-0.027
XLOC-039121
0.067
elavl3
-0.026
cldn10b
0.067
gpm6bb
-0.026
XLOC-039841
0.067
rnasekb
-0.026
lamc2
0.065
nhlh2
-0.026
hspb1
0.065
CR848047.1
-0.026
LOC103909874.1
0.064
fabp7a
-0.025
ndst2a
0.064
npas1
-0.025
BX957251.1
0.064
si:dkeyp-75h12.5
-0.025
XLOC-013086
0.064
mkrn1
-0.025
nop58
0.063
actc1b
-0.025
CU694380.1
0.062
scrt2
-0.024
otol1a
0.062
tpma
-0.024
c19h1orf216
0.062
si:ch211-133n4.4
-0.024
npm1a
0.061
nova2
-0.024
pcna
0.060
zgc:165461
-0.023
apela
0.059
ube2d4
-0.023
dkc1
0.059
mt-co2
-0.023
znfl2a
0.059
ube2ql1
-0.023
LOC103909745
0.059
marcksl1b
-0.023