Daniocell
opa3 (pronephros)
outer mitochondrial membrane lipid metabolism regulator OPA3
ZFIN
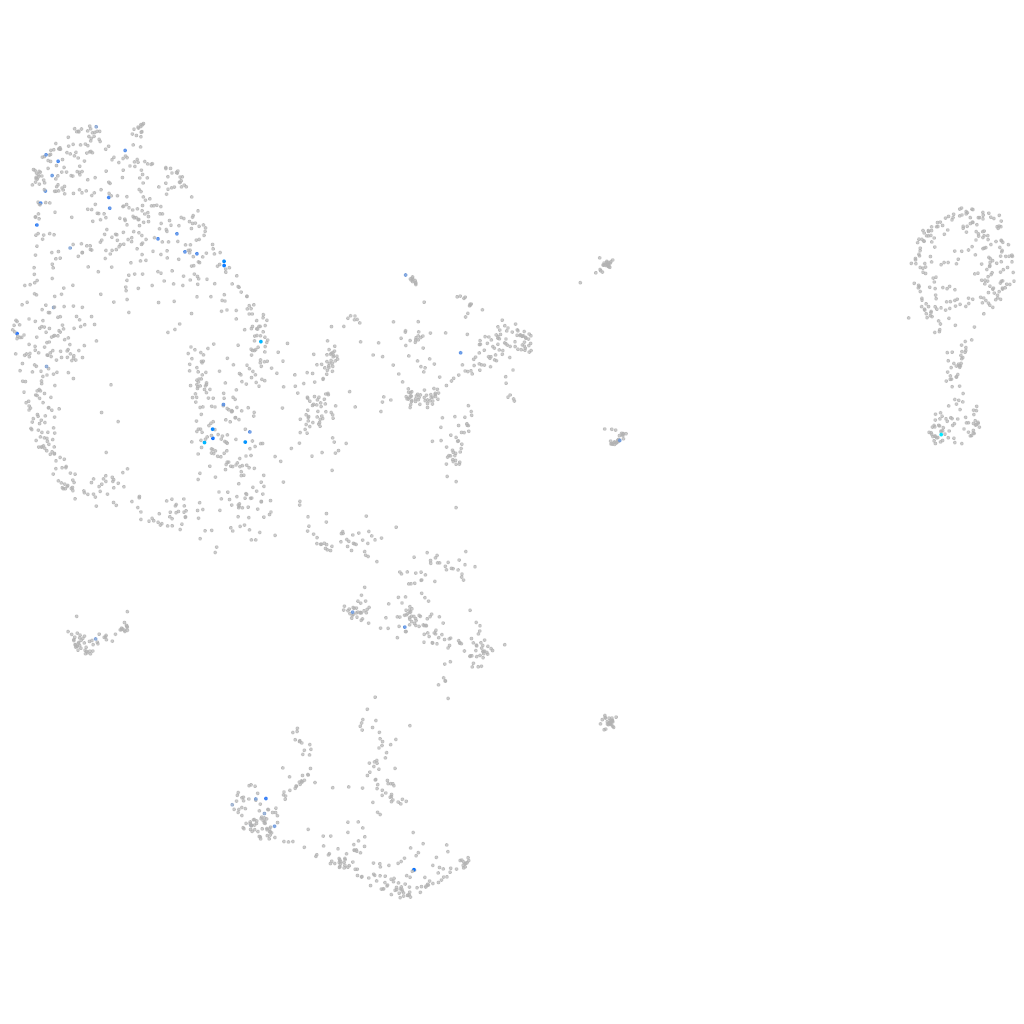
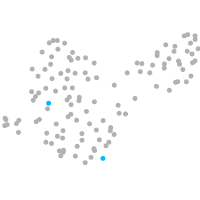
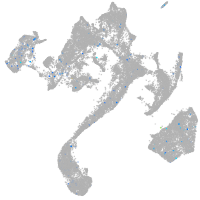
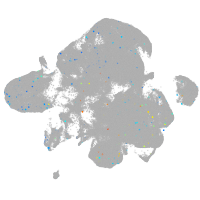
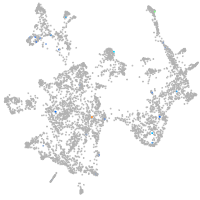
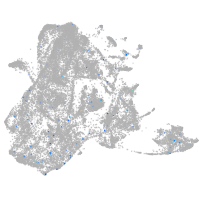
Gene expression UMAP
Display:
Expression
Stage
Other cell groups
all cells
blastomeres
PGCs
endoderm
axial mesoderm
muscle
mural cells /
non-skeletal muscle
mesenchyme
hematopoietic /
vasculature
pronephros
neural
spinal cord / glia
eye
taste / olfactory
otic / lateral line
epidermis
periderm
fin
ionocytes / mucous
pigment cells
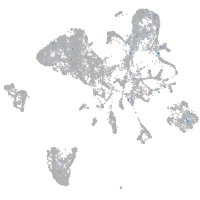
Expression by stage/cluster
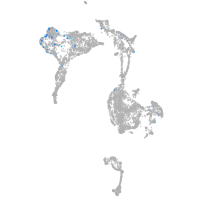
Correlated gene expression
Positive correlation
Negative correlation
Gene
r
Gene
r
cyp27b1
0.407
marcksl1b
-0.075
si:dkey-187i8.2
0.348
hmgb1a
-0.059
rcvrnb
0.314
si:ch73-1a9.3
-0.058
si:ch211-76m11.9
0.313
jpt1b
-0.058
LOC103910533
0.265
smc1al
-0.056
adora2ab
0.243
khdrbs1a
-0.055
nme2a
0.238
setb
-0.055
LOC103910611
0.230
nono
-0.054
XLOC-034584
0.230
h3f3d
-0.053
BX936397.2
0.223
id3
-0.052
CR354588.1
0.219
ube2e1
-0.052
LOC108181393
0.208
snrpd3l
-0.051
BX649242.1
0.201
dcun1d5
-0.051
BX511311.2
0.201
dek
-0.050
bhlha15
0.200
srsf11
-0.050
si:dkey-219e21.4
0.197
tuba1a
-0.050
si:busm1-194e12.11
0.195
si:dkey-42i9.4
-0.050
XLOC-032271
0.193
tubb2b
-0.050
chpfb
0.191
rtf1
-0.050
LOC110439535
0.188
nudc
-0.049
CU896647.1
0.188
marcksb
-0.049
FO834799.2
0.186
rab2a
-0.048
si:dkey-7j22.1
0.184
msna
-0.048
LOC101882135
0.179
si:ch211-276i12.9
-0.048
si:ch211-215e19.3
0.179
hmgb3a
-0.047
CABZ01067150.1
0.176
hoxc3a
-0.047
csf3b
0.172
lsm12b
-0.047
aqp8a.1
0.172
dnajc8
-0.047
vcanb
0.162
tmeff1b
-0.047
uhrf1bp1l
0.160
chd4b
-0.046
ubac2
0.153
snrpe
-0.046
si:ch211-197l9.5
0.153
cd2bp2
-0.046
LO017852.1
0.152
hmgb1b
-0.046
BX323457.1
0.151
mbd3a
-0.045
ptgis
0.151
mki67
-0.045