Daniocell
nsmce1 (pronephros)
"NSE1 homolog, SMC5-SMC6 complex component"
ZFIN
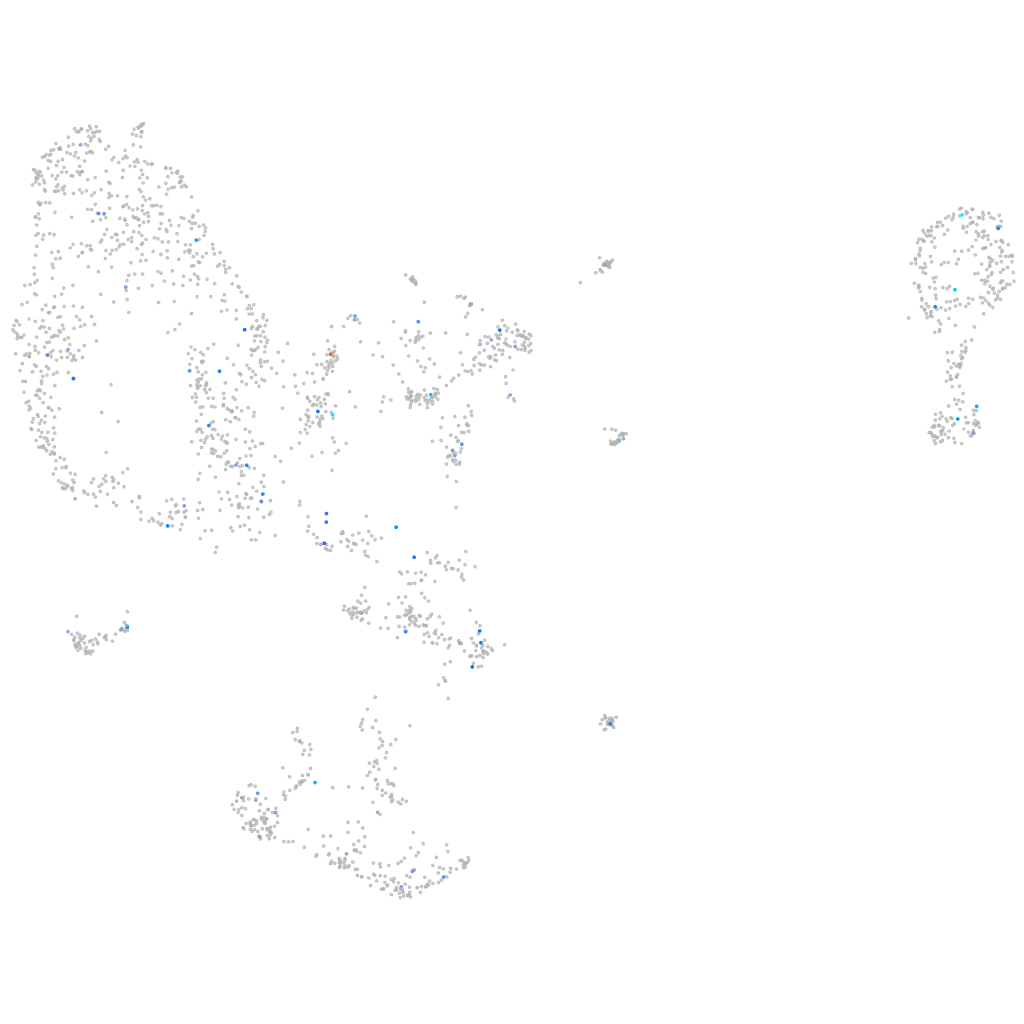
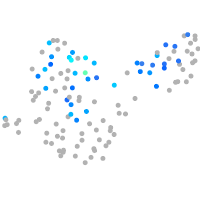
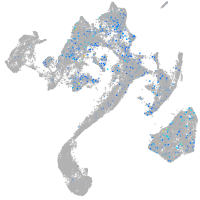
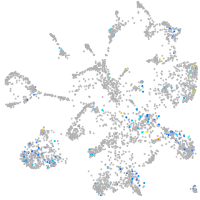
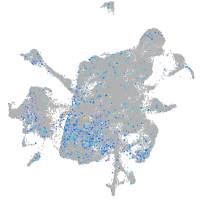
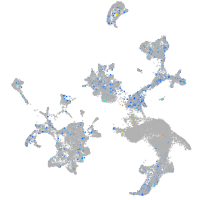
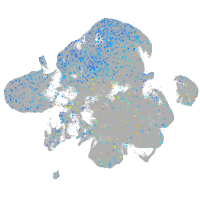
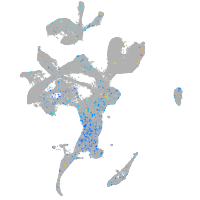
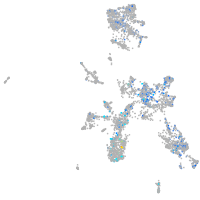
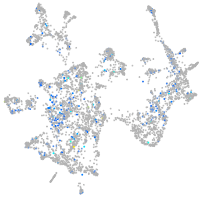
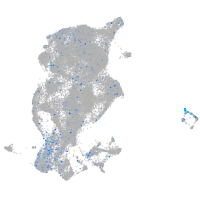
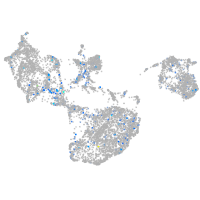
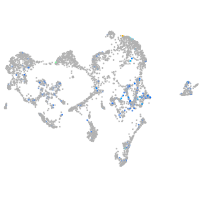
Gene expression UMAP
Display:
Expression
Stage
Other cell groups
all cells
blastomeres
PGCs
endoderm
axial mesoderm
muscle
mural cells /
non-skeletal muscle
mesenchyme
hematopoietic /
vasculature
pronephros
neural
spinal cord / glia
eye
taste / olfactory
otic / lateral line
epidermis
periderm
fin
ionocytes / mucous
pigment cells
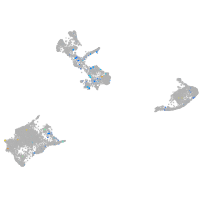
Expression by stage/cluster
Correlated gene expression
Positive correlation
Negative correlation
Gene
r
Gene
r
coro7
0.336
mt-co1
-0.071
pkdc
0.280
mt-co2
-0.068
nceh1b.1
0.266
rps27l
-0.062
xpnpep2
0.266
pabpc1a
-0.061
FP074874.2
0.243
slc22a4
-0.058
BX511061.1
0.237
phyhd1
-0.056
BX649324.1
0.232
sgk1
-0.056
CT573793.1
0.229
pitpnc1b
-0.055
zgc:161973
0.212
xirp1
-0.055
LOC101885297
0.208
ndufb7
-0.055
si:ch211-219a15.3
0.199
BX927308.2
-0.055
mmp28
0.192
cx32.3
-0.055
fthl30
0.189
mt-cyb
-0.055
LOC108182459
0.182
csad
-0.054
LOC101882334
0.181
kyat1
-0.054
nfatc1
0.180
slc15a2
-0.054
galnt8b.2
0.176
sdha
-0.054
XLOC-037016
0.176
slc13a3
-0.054
si:dkey-222b8.1
0.172
rgrb
-0.053
mmrn2b
0.169
mt-nd2
-0.053
si:dkey-199m13.5
0.168
acy1
-0.053
LOC103908936
0.168
dglucy
-0.052
si:dkey-195m11.11
0.167
LOC100536156
-0.052
BX539310.1
0.167
mt-atp6
-0.052
ccdc97
0.166
cth
-0.051
htra4
0.166
slc2a11l
-0.051
ndor1
0.165
fahd1
-0.050
msmo1
0.163
slc25a20
-0.050
XLOC-012571
0.162
sdsl
-0.050
XLOC-021399
0.159
cox7a1
-0.050
rmnd1
0.158
tmem174
-0.049
tmem167b
0.157
cers2b
-0.049
BX323448.1
0.155
snx8a
-0.049
asf1ba
0.154
acaa2
-0.049
cdh26.2
0.154
DHDH
-0.049