Daniocell
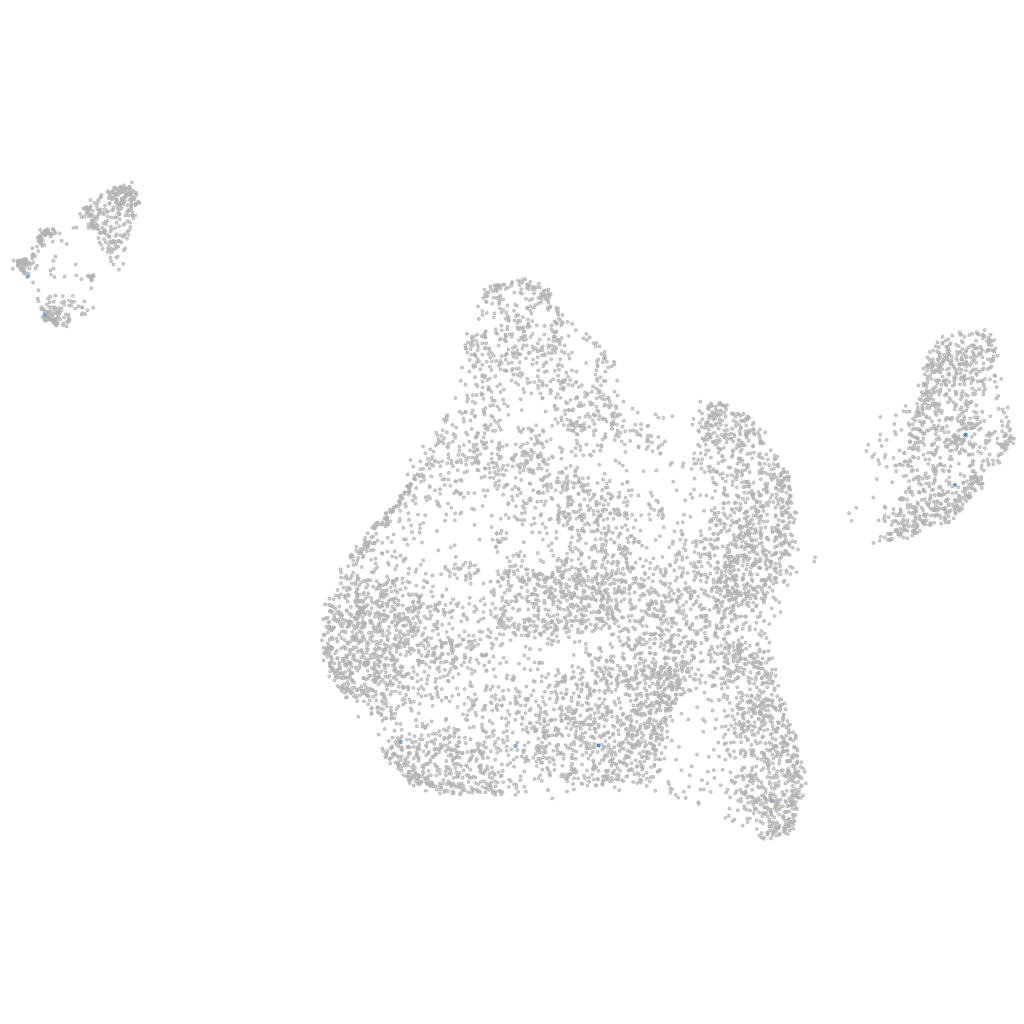
nhlh2 (blastomeres)
nescient helix loop helix 2
ZFIN
Gene expression UMAP
Display:
Expression
Stage
Other cell groups
all cells
blastomeres
PGCs
endoderm
axial mesoderm
muscle
mural cells /
non-skeletal muscle
mesenchyme
hematopoietic /
vasculature
pronephros
neural
spinal cord / glia
eye
taste / olfactory
otic / lateral line
epidermis
periderm
fin
ionocytes / mucous
pigment cells
Expression by stage/cluster
Correlated gene expression
Positive correlation
Negative correlation
Gene
r
Gene
r
CU856520.1
0.290
CR383676.1
-0.027
CABZ01001434.1
0.263
snrpf
-0.025
npffr1
0.263
psmb3
-0.023
XLOC-016965
0.263
ybx1
-0.022
nrcamb
0.259
rps28
-0.022
prcd
0.223
pcna
-0.021
ccdc17
0.216
tmed2
-0.021
zgc:113276
0.198
rpl23
-0.021
FO904997.1
0.172
stm
-0.021
LOC103911961
0.172
ubb
-0.020
LOC110438482
0.172
aldob
-0.020
LOC100536607
0.164
ruvbl2
-0.019
XLOC-015407
0.156
hmgn6
-0.019
si:dkeyp-23e4.3
0.150
atp5md
-0.019
cdkn1ba
0.147
gpc4
-0.018
LOC103911747
0.144
rpl11
-0.018
zgc:174904
0.143
si:dkey-151g10.6
-0.018
CU694255.2
0.142
ywhaqb
-0.018
CR361560.1
0.128
gadd45gip1
-0.018
XLOC-043931
0.128
hnrnpa0b
-0.018
CABZ01084347.1
0.128
cycsb
-0.018
XLOC-002555
0.122
nop56
-0.018
chga
0.121
rpl30
-0.018
otofa
0.117
eef1a1l1
-0.017
CABZ01011209.1
0.116
zgc:110540
-0.017
CR786571.1
0.109
rsl1d1
-0.017
sult1st3
0.109
rps26l
-0.017
ncs1b
0.107
vdac2
-0.017
terb1
0.107
ca9
-0.017
LOC100331743
0.106
vox
-0.017
LOC101886439
0.104
CR383676.2
-0.017
itih1
0.101
hmga1a
-0.017
prr15lb
0.100
CU929070.1
-0.017
sec14l8
0.097
marcksl1b
-0.017
LOC103910269
0.094
rpl39
-0.017