Daniocell
nedd1 (fin)
NEDD1 gamma-tubulin ring complex targeting factor
ZFIN
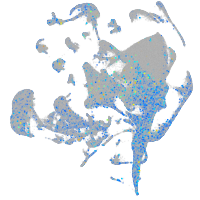
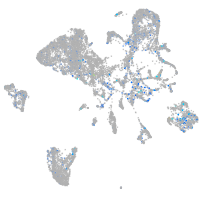
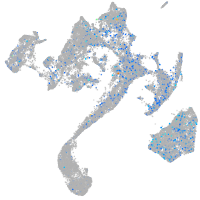
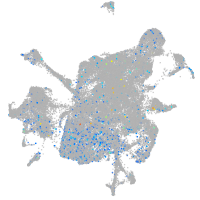
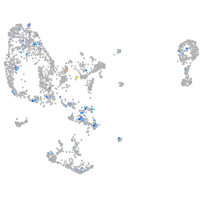
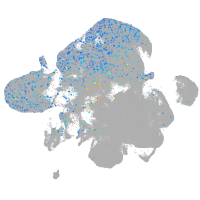
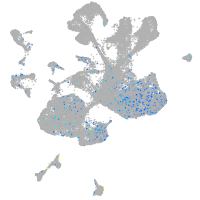
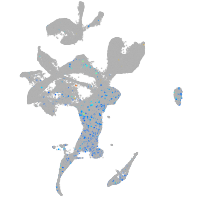
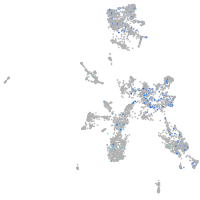
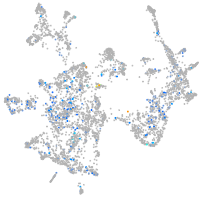
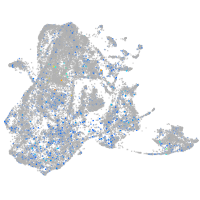
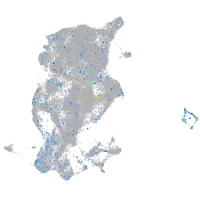
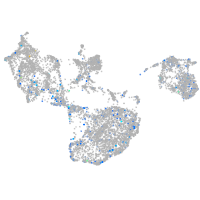
Gene expression UMAP
Display:
Expression
Stage
Other cell groups
all cells
blastomeres
PGCs
endoderm
axial mesoderm
muscle
mural cells /
non-skeletal muscle
mesenchyme
hematopoietic /
vasculature
pronephros
neural
spinal cord / glia
eye
taste / olfactory
otic / lateral line
epidermis
periderm
fin
ionocytes / mucous
pigment cells
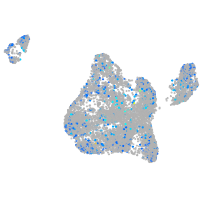
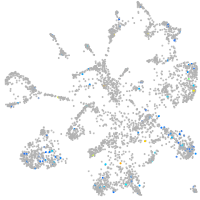
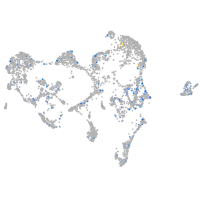
Expression by stage/cluster
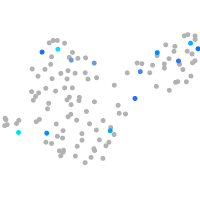
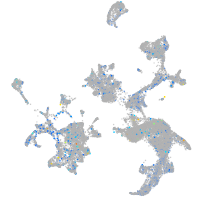
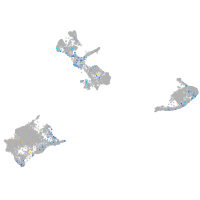
Correlated gene expression
Positive correlation
Negative correlation
Gene
r
Gene
r
phc3
0.185
and2
-0.064
BX323855.2
0.174
ucp1
-0.044
clrn3
0.160
qdpra
-0.043
LOC103910556
0.159
CABZ01074130.1
-0.041
si:dkey-201l21.4
0.145
col1a1a
-0.041
BX284620.1
0.140
LOC100538221
-0.041
klf5b
0.139
pah
-0.038
AL929009.1
0.137
and1
-0.038
znf1069
0.137
ptx3a
-0.037
gnrh3
0.136
ecrg4a
-0.036
LOC103910996
0.131
pcbd1
-0.036
CABZ01071909.1
0.126
hpdb
-0.036
XLOC-006868
0.126
hgd
-0.035
si:ch211-172l8.4
0.124
rbp4
-0.035
zgc:194906.1
0.122
klf15
-0.035
nek2
0.120
calm1a
-0.034
LOC110438512
0.117
aqp3a
-0.034
prl
0.117
cebpd
-0.034
si:dkey-261m9.17
0.113
si:ch211-140m22.7
-0.033
mki67
0.113
gchfr
-0.032
LOC103908684
0.113
nfia
-0.031
zgc:172014
0.110
CELA1 (1 of many)
-0.031
LOC110439813
0.109
si:ch211-76l23.4
-0.030
CU468041.1
0.106
adgrg6
-0.030
fbxo5
0.105
loxa
-0.030
ccna2
0.105
mtss1la
-0.030
mllt1b
0.102
ttc36
-0.029
si:zfos-364h11.2
0.100
zic5
-0.029
kif15
0.100
hapln1a
-0.028
LOC110438288
0.099
gapdh
-0.028
nuf2
0.099
zic2a
-0.027
si:dkey-57a22.11
0.099
fhl2a
-0.027
ttll9
0.098
gng13b
-0.027
si:ch211-63o20.7
0.098
bhmt
-0.027
ccnb2
0.098
diras1a
-0.027