Daniocell
nckipsd (taste / olfactory)
NCK interacting protein with SH3 domain
ZFIN
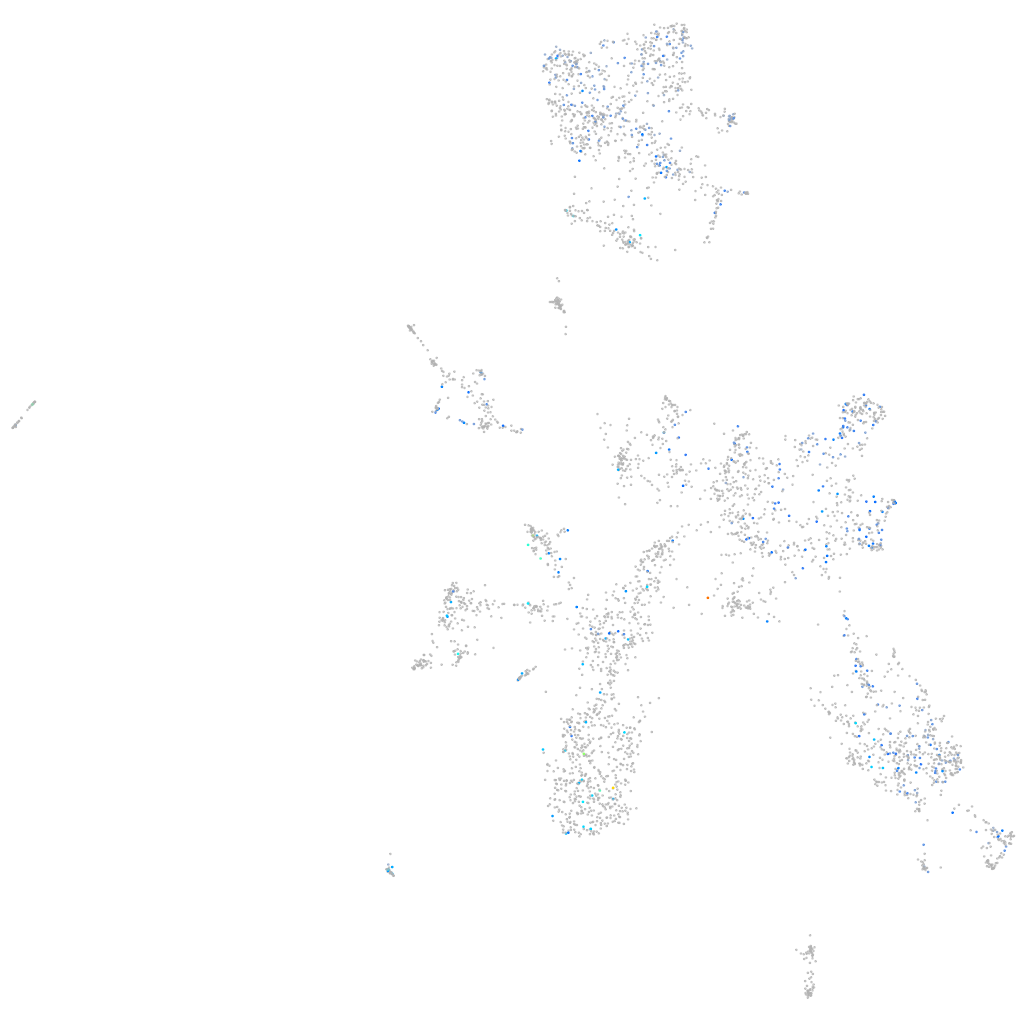
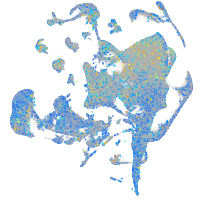
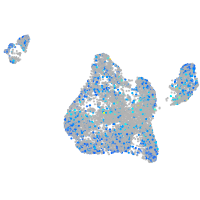
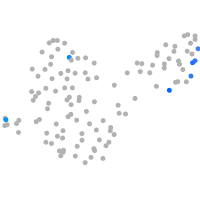
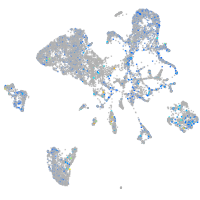
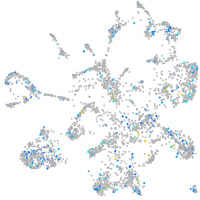
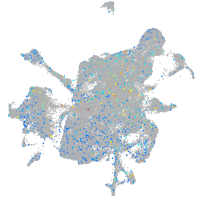
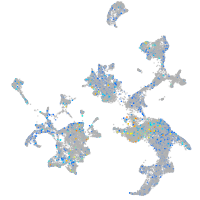
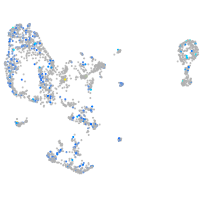
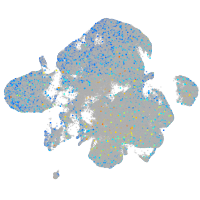
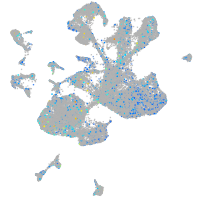
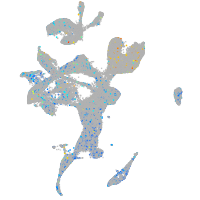
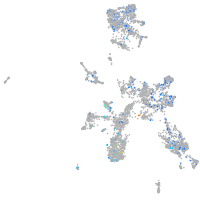
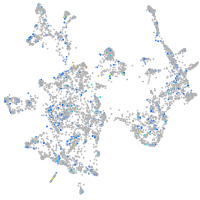
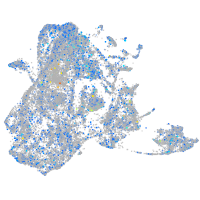
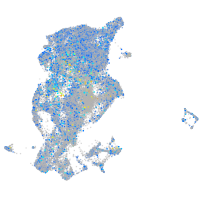
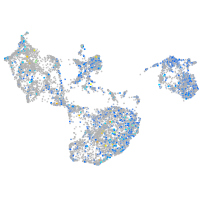
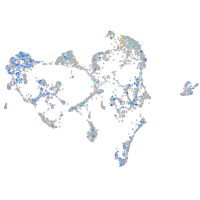
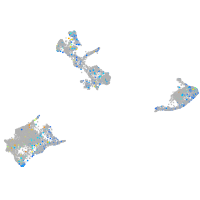
Gene expression UMAP
Display:
Expression
Stage
Other cell groups
all cells
blastomeres
PGCs
endoderm
axial mesoderm
muscle
mural cells /
non-skeletal muscle
mesenchyme
hematopoietic /
vasculature
pronephros
neural
spinal cord / glia
eye
taste / olfactory
otic / lateral line
epidermis
periderm
fin
ionocytes / mucous
pigment cells
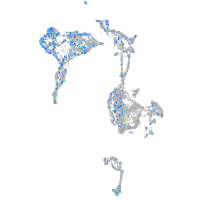
Expression by stage/cluster
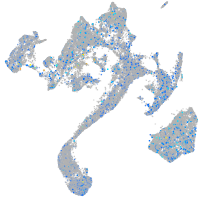
Correlated gene expression
Positive correlation
Negative correlation
Gene
r
Gene
r
si:ch211-219a15.3
0.162
stmn1b
-0.061
mmel1
0.147
atp6v1c1b
-0.056
klb
0.141
b3gat1b
-0.054
LOC110437837
0.139
myhz1.1
-0.049
pus7l
0.129
myhz1.2
-0.047
CR788230.2
0.127
josd2
-0.047
c1qtnf5
0.115
elocb
-0.046
LOC795227
0.115
insm1a
-0.045
pigrl2.3
0.113
DYNC2H1
-0.044
LOC101883107
0.113
insm1b
-0.044
bcl6b
0.111
tuba1a
-0.043
kcnj12b
0.108
actc1b
-0.043
or124-4
0.108
pknox2
-0.043
si:dkey-47k20.8
0.108
pde6d
-0.042
si:ch211-196f19.1
0.108
rtn1b
-0.042
CU855801.1
0.107
AP3B2
-0.042
vwc2l
0.105
apoob
-0.042
LOC110438012
0.104
gng3
-0.042
BX470218.1
0.103
carmil2
-0.041
ftr61
0.101
uncx4.1
-0.041
urgcp
0.101
myt1a
-0.040
LOC103910731
0.100
map7d2b
-0.040
si:ch211-197g15.8
0.100
CABZ01102240.1
-0.040
si:ch211-76l23.7
0.099
bcas3
-0.040
kntc1
0.099
si:ch211-10a23.2
-0.040
adad1
0.098
tmsb
-0.039
wdhd1
0.097
wu:fb18f06
-0.039
ptgesl
0.096
hdlbpb
-0.039
BX119915.1
0.094
eno2
-0.039
fli1b
0.094
cldnd1a
-0.039
prkcab
0.094
cpeb2
-0.039
zfp36l1a
0.093
apoa1b
-0.039
BX088583.1
0.093
COX3
-0.039
LOC101884756
0.092
rtn1a
-0.039
BX005129.2
0.092
pdzd11
-0.039