Daniocell
mtif2 (ionocytes / mucous-producing)
mitochondrial translational initiation factor 2
ZFIN
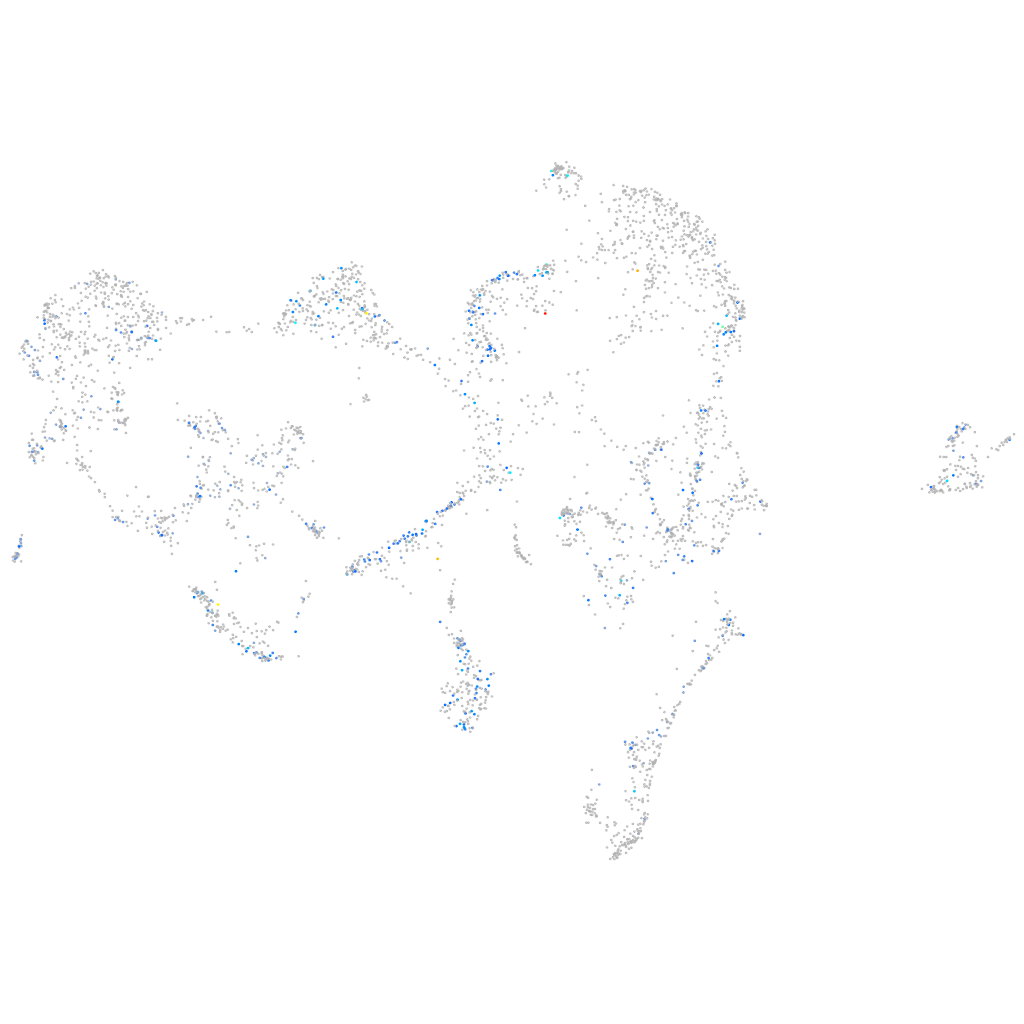
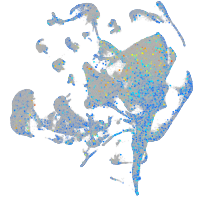
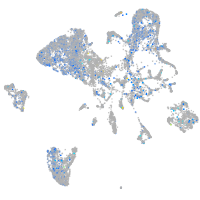
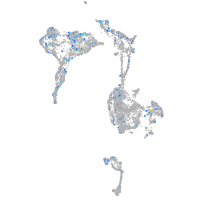
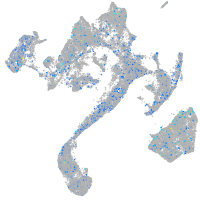
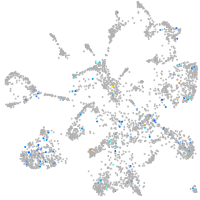
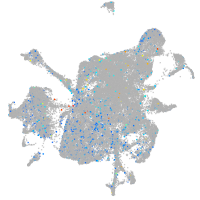
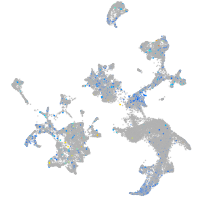
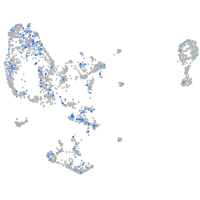
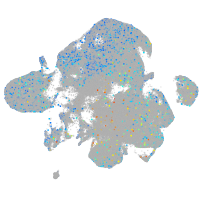
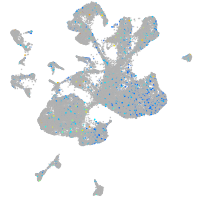
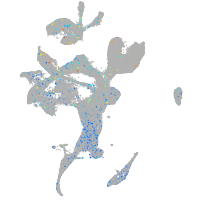
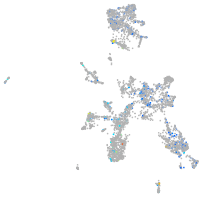
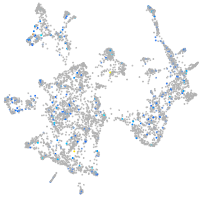
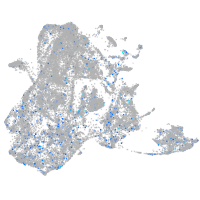
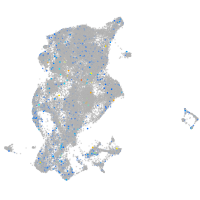
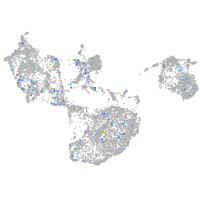
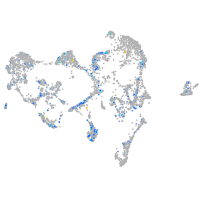
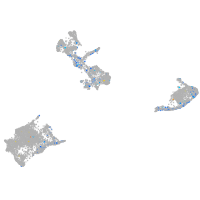
Gene expression UMAP
Display:
Expression
Stage
Other cell groups
all cells
blastomeres
PGCs
endoderm
axial mesoderm
muscle
mural cells /
non-skeletal muscle
mesenchyme
hematopoietic /
vasculature
pronephros
neural
spinal cord / glia
eye
taste / olfactory
otic / lateral line
epidermis
periderm
fin
ionocytes / mucous
pigment cells
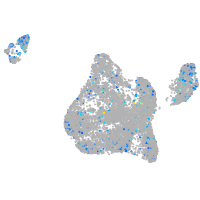
Expression by stage/cluster
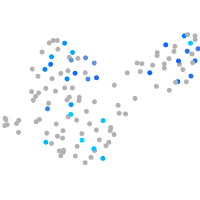
Correlated gene expression
Positive correlation
Negative correlation
Gene
r
Gene
r
XLOC-026746
0.251
krt5
-0.102
si:ch211-212k5.4
0.242
LOC110438378
-0.091
zgc:174895
0.211
muc5.1
-0.091
si:ch211-167j9.4
0.191
si:dkey-65b12.6
-0.089
CR392002.1
0.182
aldob
-0.089
XLOC-023624
0.180
atp2a3
-0.087
arl16
0.168
rpl36
-0.087
stoml3a
0.168
crip1
-0.082
got2b
0.165
agr2
-0.080
ndufb10
0.160
krt91
-0.079
uqcrfs1
0.159
grb10a
-0.078
atp5mc1
0.159
muc5.2
-0.078
cox7a2a
0.159
krtt1c19e
-0.077
si:dkey-119f1.1
0.158
cebpd
-0.077
ldhba
0.158
cmah
-0.076
prrx1b
0.157
b3gnt7
-0.074
idh2
0.155
si:dkey-33i11.9
-0.072
mt-nd1
0.155
si:dkey-248g15.3
-0.072
chchd10
0.155
gng13b
-0.071
uqcrc1
0.155
si:dkey-33c14.3
-0.071
ndufb5
0.154
stard10
-0.071
atp5f1b
0.153
foxq1a
-0.071
si:dkeyp-72e1.7
0.153
fosab
-0.070
atp5pd
0.153
rplp2
-0.070
atp6v1e1b
0.151
sytl1
-0.069
ndufa11
0.151
cast
-0.069
eno3
0.151
fbp1a
-0.068
cox5ab
0.150
slc38a5b
-0.067
mal2
0.149
spaca4l
-0.067
aifm1
0.149
zgc:112994
-0.067
cycsb
0.149
cracr2b
-0.066
csad
0.148
zgc:92380
-0.065
ndufab1b
0.148
si:ch73-306e8.2
-0.065
atp6v1ba
0.148
p2rx1
-0.064
XLOC-000527
0.148
ucp2
-0.063