Daniocell
ms4a17a.8 (glial cells / spinal cord)
"membrane-spanning 4-domains, subfamily A, member 17A.8"
ZFIN
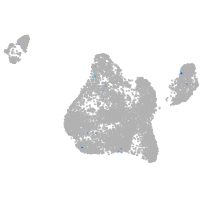
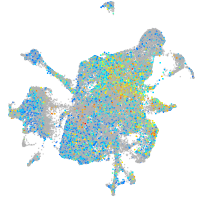
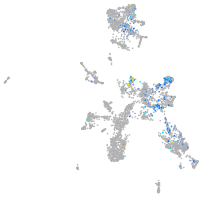
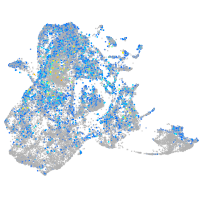
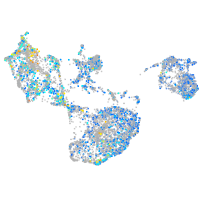
Gene expression UMAP
Display:
Expression
Stage
Other cell groups
all cells
blastomeres
PGCs
endoderm
axial mesoderm
muscle
mural cells /
non-skeletal muscle
mesenchyme
hematopoietic /
vasculature
pronephros
neural
spinal cord / glia
eye
taste / olfactory
otic / lateral line
epidermis
periderm
fin
ionocytes / mucous
pigment cells
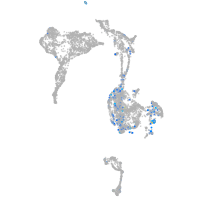
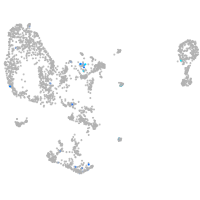
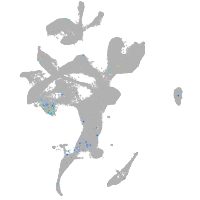
Expression by stage/cluster
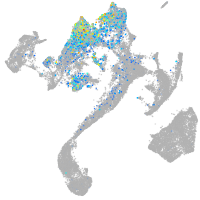
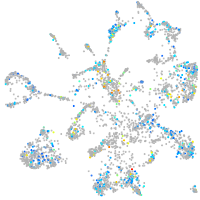
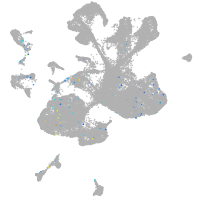
Correlated gene expression
Positive correlation
Negative correlation
Gene
r
Gene
r
abcg5
0.106
ptmab
-0.040
gpha2
0.098
marcksb
-0.038
c1qtnf1
0.097
hnrnpaba
-0.034
LOC103908906
0.091
elavl3
-0.034
fmoda
0.085
zc4h2
-0.033
olfml3b
0.079
hmgb3a
-0.032
pcolcea
0.076
tuba1c
-0.032
LO018598.1
0.074
rtn1a
-0.031
nkx2.4b
0.072
h3f3d
-0.031
LOC103909675
0.071
si:ch211-288g17.3
-0.031
htra3b
0.070
tubb2b
-0.031
col6a1
0.067
hmgn6
-0.030
si:ch73-27e22.7
0.065
nova2
-0.030
si:ch1073-291c23.2
0.064
nkain1
-0.030
LOC100333290
0.063
cfl1
-0.028
fezf2
0.062
hmga1a
-0.028
edaradd
0.062
tmeff1b
-0.028
col6a3
0.061
si:dkey-276j7.1
-0.028
si:ch1073-214b20.2
0.061
hp1bp3
-0.027
angptl5
0.061
hnrnpa0l
-0.027
si:dkey-27b3.4
0.061
hnrnpa0a
-0.027
ahnak
0.060
hsp90ab1
-0.027
LOC405768
0.060
nucks1a
-0.026
chrnb1
0.059
cirbpa
-0.026
fibina
0.059
tubb5
-0.026
crygs2
0.059
khdrbs1a
-0.026
bhmt
0.058
si:ch73-1a9.3
-0.026
ms4a17a.7
0.058
ptmaa
-0.026
mxra8b
0.058
epb41a
-0.026
si:ch73-334d15.4
0.057
creb1a
-0.025
CU914487.1
0.057
cct2
-0.025
CR382383.2
0.057
myt1a
-0.025
LOC100537733
0.057
myt1b
-0.025
LOC110438203
0.057
fabp3
-0.025
BX119902.1
0.057
hnrnpa0b
-0.025