Daniocell
mov10a (eye)
Mov10 RISC complex RNA helicase a
ZFIN
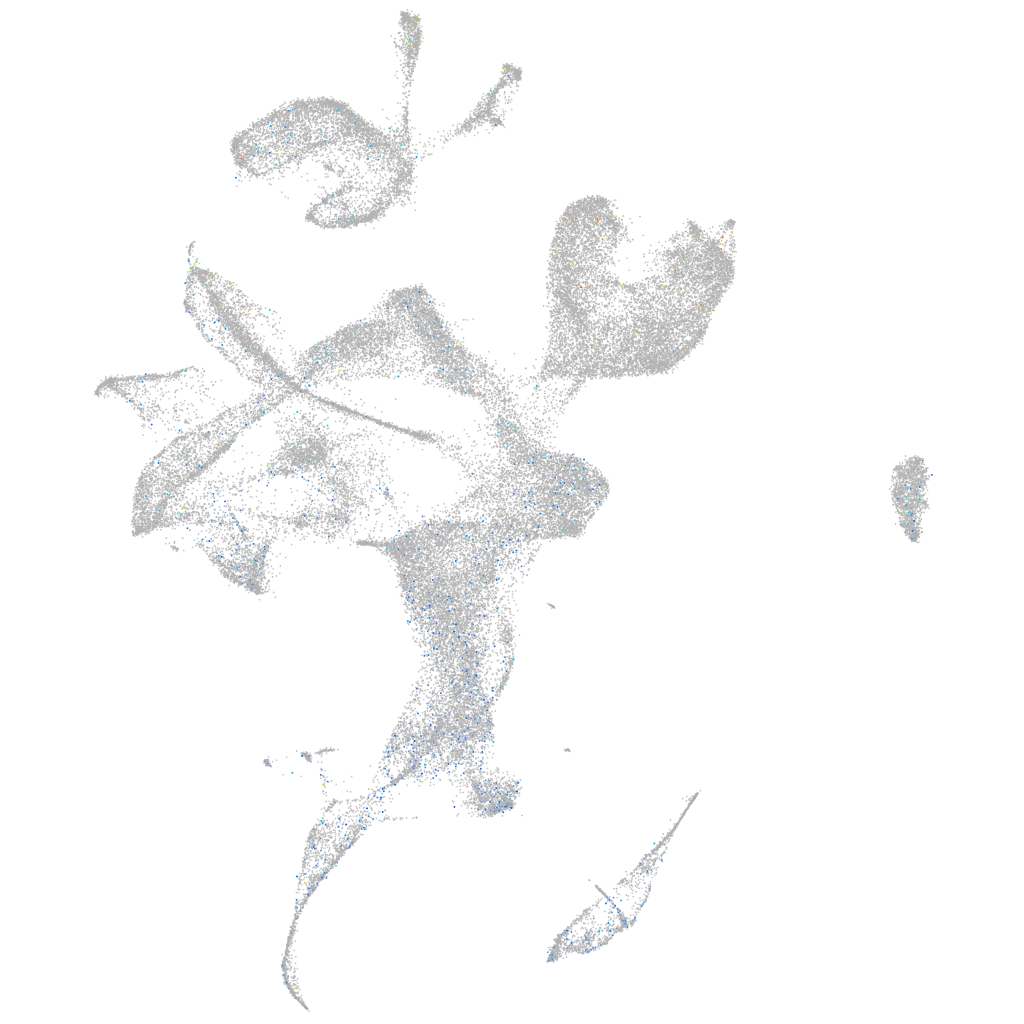
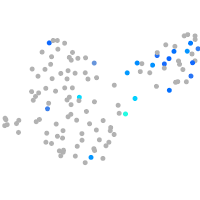
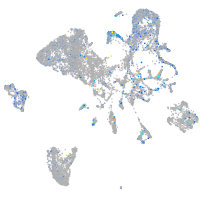
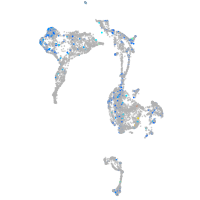
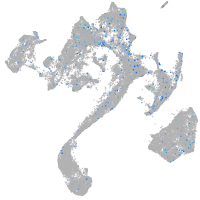
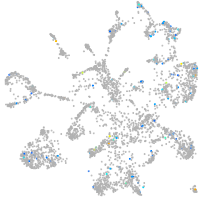
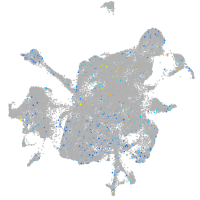
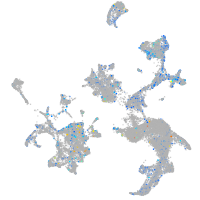
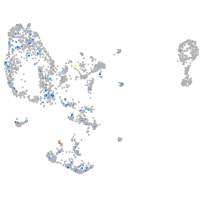
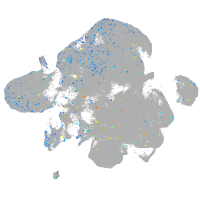
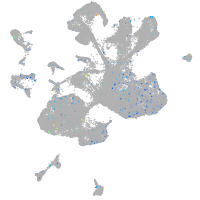
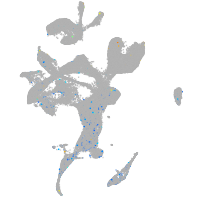
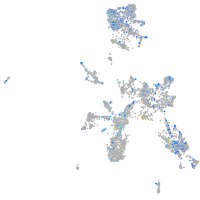
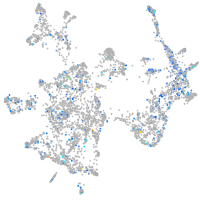
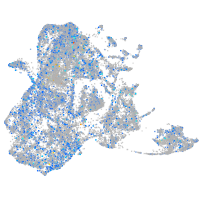
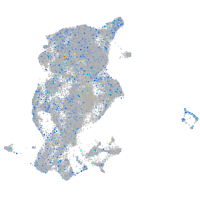
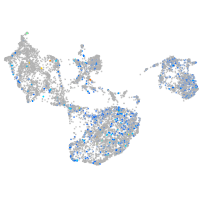
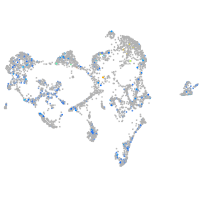
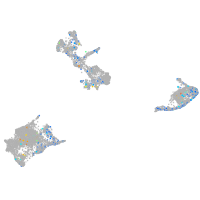
Gene expression UMAP
Display:
Expression
Stage
Other cell groups
all cells
blastomeres
PGCs
endoderm
axial mesoderm
muscle
mural cells /
non-skeletal muscle
mesenchyme
hematopoietic /
vasculature
pronephros
neural
spinal cord / glia
eye
taste / olfactory
otic / lateral line
epidermis
periderm
fin
ionocytes / mucous
pigment cells
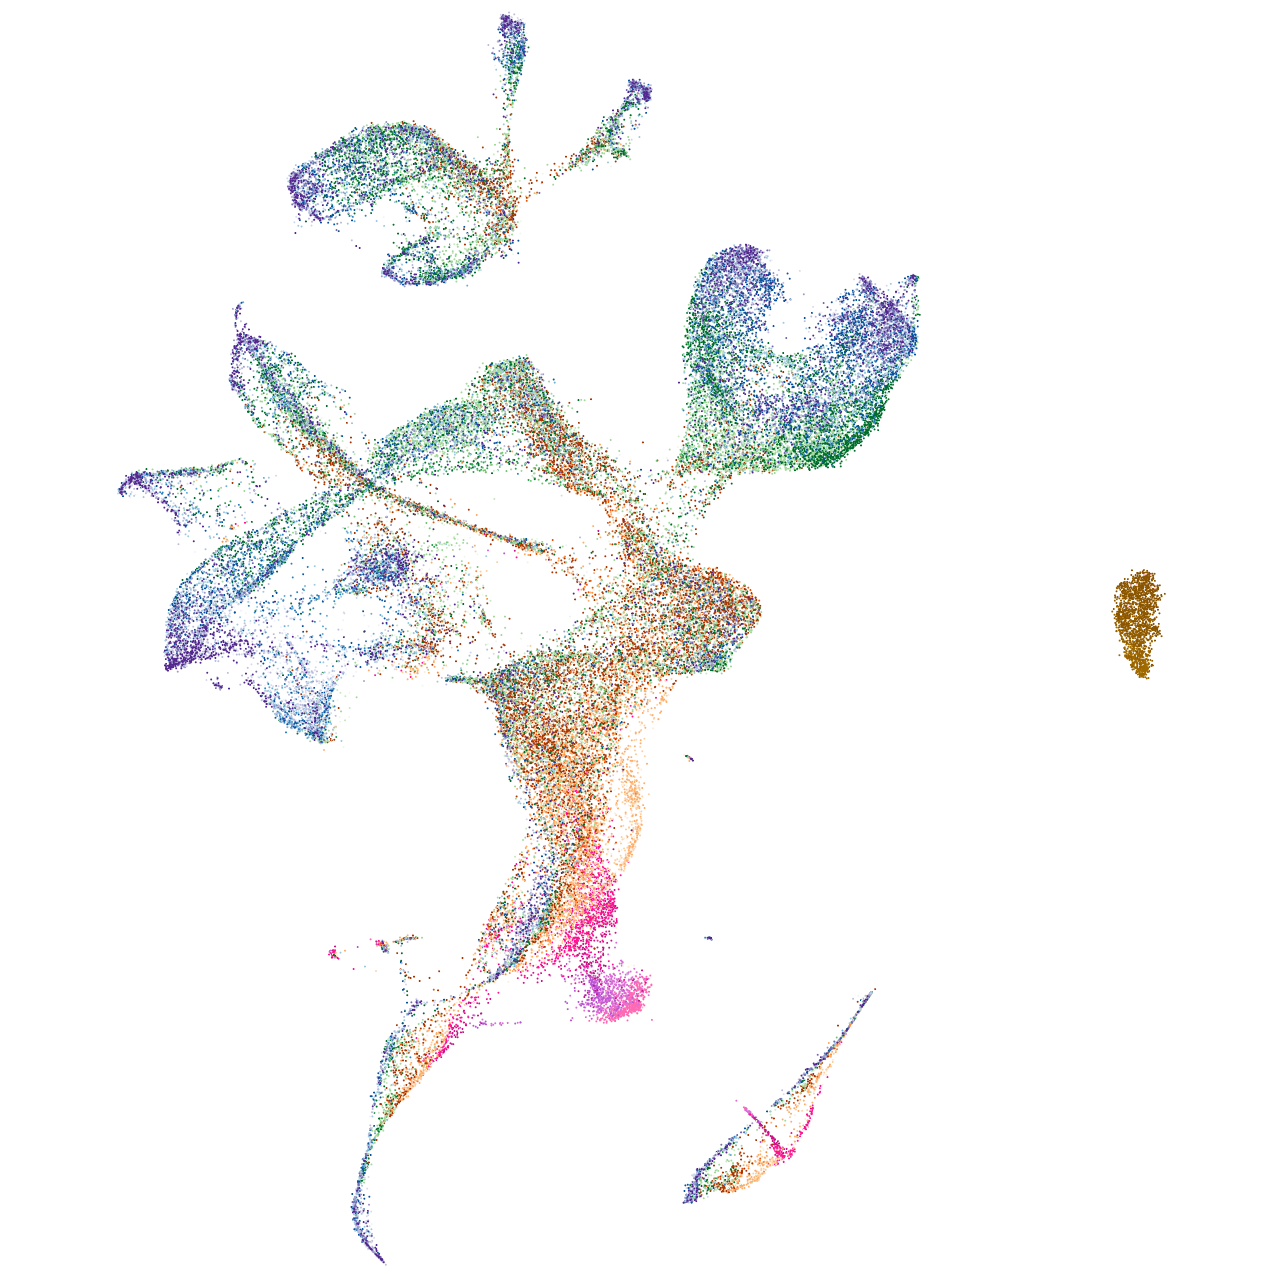
Expression by stage/cluster
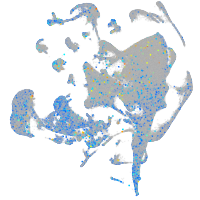
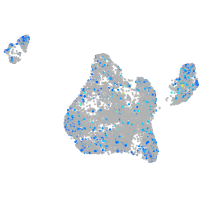
Correlated gene expression
Positive correlation
Negative correlation
Gene
r
Gene
r
si:ch73-91k6.1
0.069
ptmab
-0.040
LOC110437705
0.065
rorb
-0.026
bmp10
0.062
si:ch73-1a9.3
-0.025
LOC796088
0.060
scrt2
-0.025
LOC101885599
0.060
hmgn6
-0.025
si:ch73-47f2.1
0.057
bcl2l10
-0.024
senp6b
0.056
ndrg1b
-0.024
hspb12
0.056
ptmaa
-0.023
si:dkey-79i2.4
0.052
hunk
-0.021
or137-4
0.052
ckbb
-0.020
LOC110437765
0.049
gpm6aa
-0.020
gpr184
0.048
btg1
-0.020
LOC108179505
0.045
marcksl1b
-0.019
LOC108181081
0.045
si:dkey-56m19.5
-0.019
LOC100536469
0.043
crx
-0.018
LOC103910163
0.042
hmgb1a
-0.018
fosab
0.042
nyap2b
-0.018
CU019562.2
0.042
myt1b
-0.018
lepb
0.041
marcksl1a
-0.018
LOC799796
0.040
foxg1b
-0.017
CT573357.1
0.040
sox12
-0.017
LOC103910447
0.039
actc1b
-0.017
cx43
0.039
ppp1r14c
-0.017
gprc5bb
0.039
CU634008.1
-0.017
tspan36
0.039
fkbp1ab
-0.017
si:ch211-28p3.4
0.038
chd4a
-0.017
rnaseka
0.038
mylpfa
-0.016
rc3h2
0.038
si:ch211-137a8.4
-0.016
eif4ebp3l
0.037
ankrd12
-0.016
si:ch73-125k17.2
0.037
otx5
-0.015
adi1
0.037
cadm3
-0.015
CR377211.3
0.037
tnni2a.4
-0.015
RNF14
0.036
neurod4
-0.015
her6
0.036
dbn1
-0.015
fabp11a
0.036
gpm6ab
-0.015