Daniocell
micu3b (blastomeres)
"mitochondrial calcium uptake family, member 3b"
ZFIN
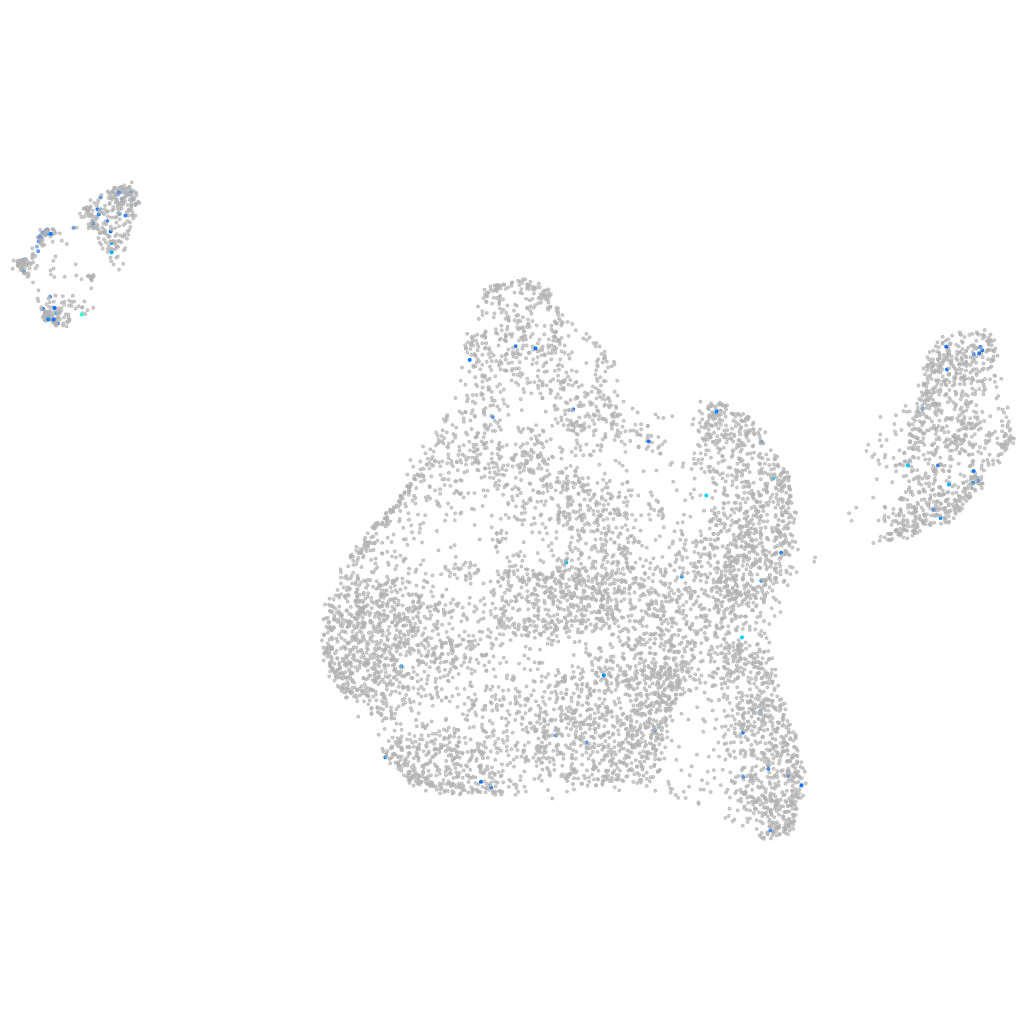
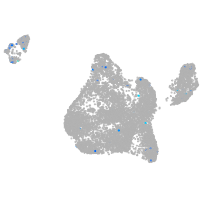
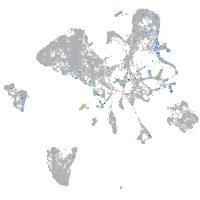
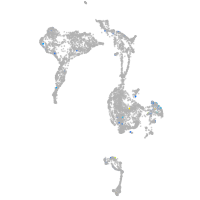
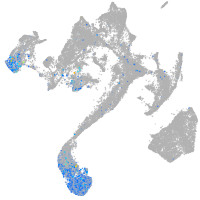
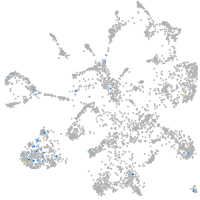
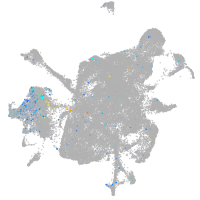
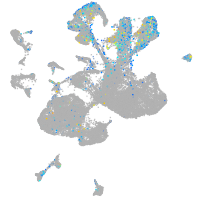
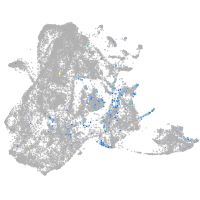
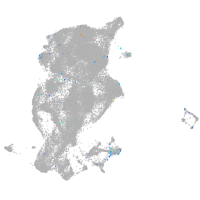
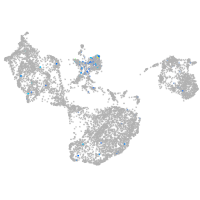
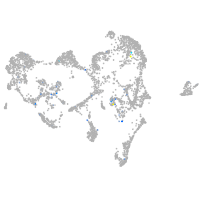
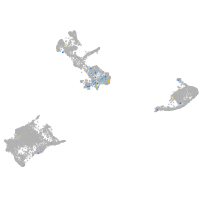
Gene expression UMAP
Display:
Expression
Stage
Other cell groups
all cells
blastomeres
PGCs
endoderm
axial mesoderm
muscle
mural cells /
non-skeletal muscle
mesenchyme
hematopoietic /
vasculature
pronephros
neural
spinal cord / glia
eye
taste / olfactory
otic / lateral line
epidermis
periderm
fin
ionocytes / mucous
pigment cells
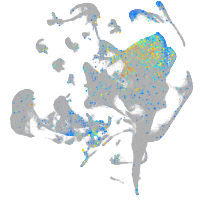
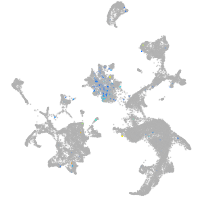
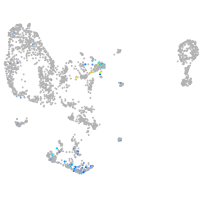
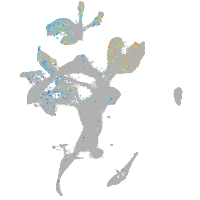
Expression by stage/cluster
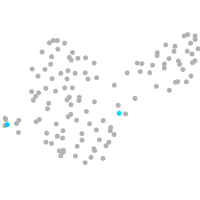
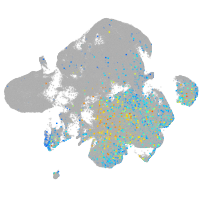
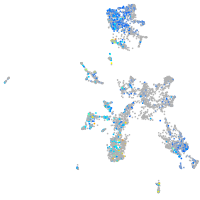
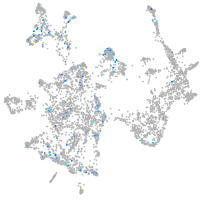
Correlated gene expression
Positive correlation
Negative correlation
Gene
r
Gene
r
si:dkeyp-72e1.7
0.206
stm
-0.136
ptprna
0.188
hspb1
-0.129
BX569785.1
0.172
si:ch73-1a9.3
-0.127
mmp16b
0.166
marcksl1b
-0.125
igsf5b
0.162
si:dkey-151g10.6
-0.124
igl3v4
0.138
dynll1
-0.121
si:ch211-216p19.5
0.133
si:ch211-152c2.3
-0.117
LOC108181163
0.132
eef1a1l1
-0.116
grk1b
0.131
si:ch211-222l21.1
-0.113
mknk2a
0.125
hnrnpa0b
-0.113
si:ch211-272h9.6
0.122
rplp1
-0.113
XLOC-044147
0.118
hmga1a
-0.110
b4galnt1a
0.118
aldob
-0.105
si:dkey-109a10.2
0.117
polr3gla
-0.103
fam49bb
0.117
ybx1
-0.102
slc17a8
0.117
hmgn6
-0.100
tmem53
0.115
rplp2l
-0.100
crispld1b
0.115
rps28
-0.096
acp5a
0.113
rps12
-0.094
LOC103910668
0.113
ptmab
-0.092
btg4
0.113
rpl7a
-0.089
qkib
0.111
hmgb2a
-0.089
ica1
0.111
rps19
-0.088
cldng
0.111
rps15
-0.087
ska2
0.110
rpl26
-0.087
afap1l1a
0.109
atp1b1a
-0.084
mid1ip1l
0.109
rps29
-0.084
zgc:162324
0.109
khdrbs1a
-0.084
chp2
0.108
rps5
-0.083
fam114a2
0.108
rplp0
-0.082
cldnd
0.108
CR383676.1
-0.082
si:ch211-139d20.3
0.108
rpl13a
-0.081
LOC110438335
0.107
rpl27
-0.081
tmem179
0.107
anp32e
-0.081
qrfpr4
0.106
rps21
-0.080