Daniocell
metap1d (fin)
methionyl aminopeptidase type 1D (mitochondrial)
ZFIN
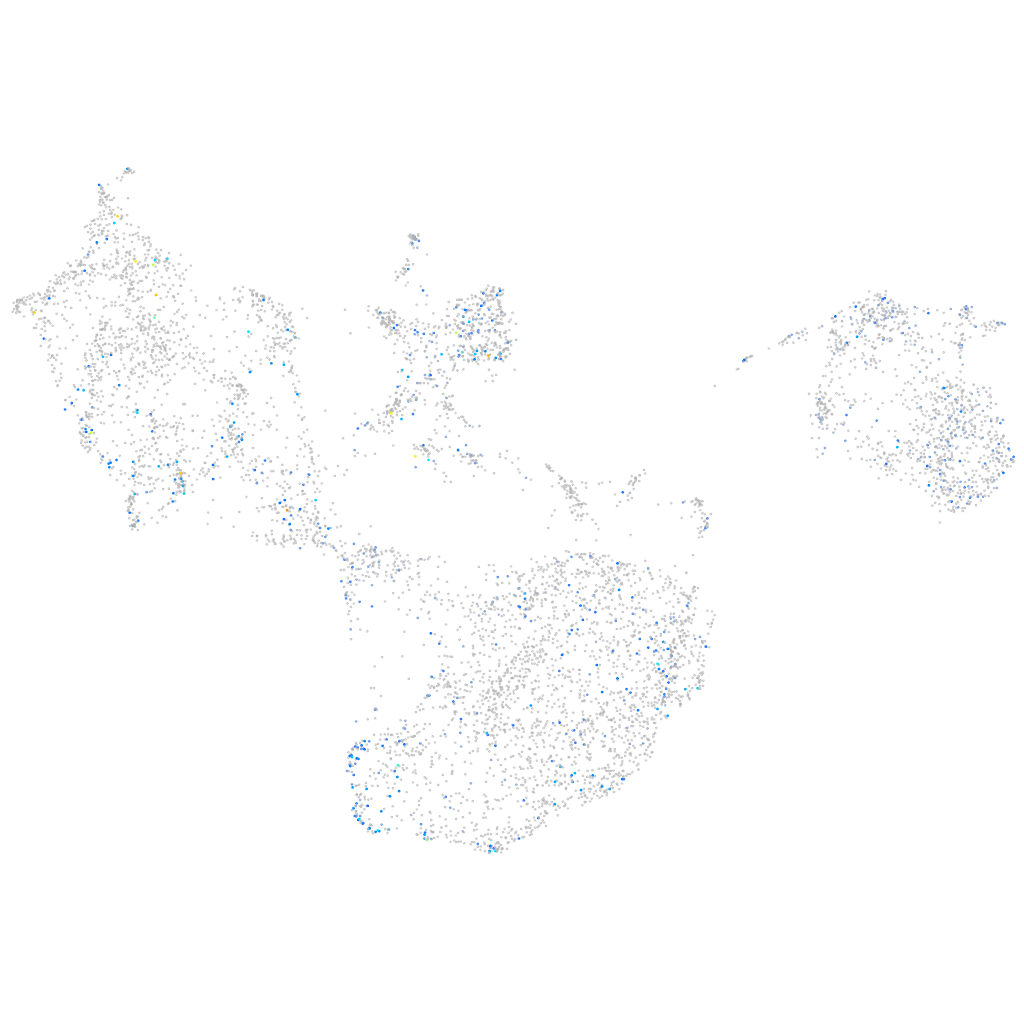
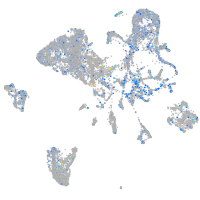
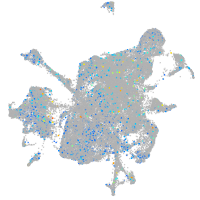
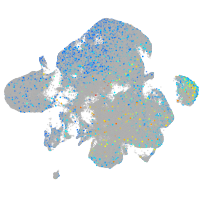
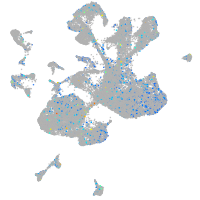
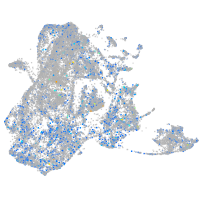
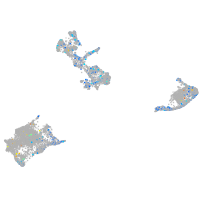
Gene expression UMAP
Display:
Expression
Stage
Other cell groups
all cells
blastomeres
PGCs
endoderm
axial mesoderm
muscle
mural cells /
non-skeletal muscle
mesenchyme
hematopoietic /
vasculature
pronephros
neural
spinal cord / glia
eye
taste / olfactory
otic / lateral line
epidermis
periderm
fin
ionocytes / mucous
pigment cells
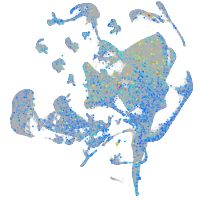
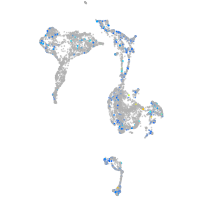
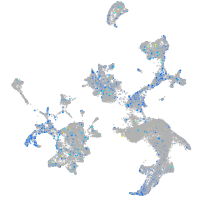
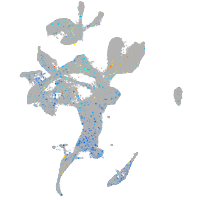
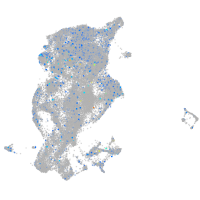
Expression by stage/cluster
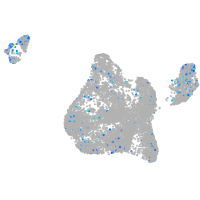
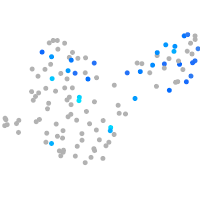
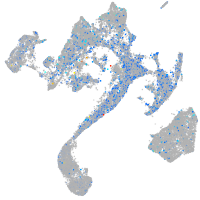
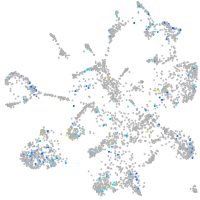
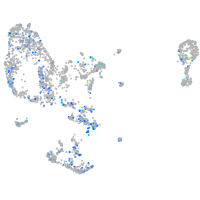
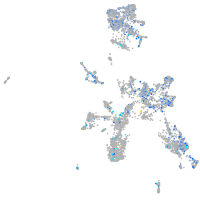
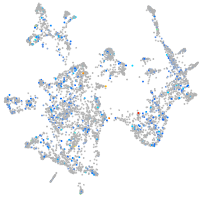
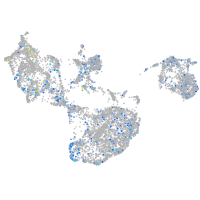
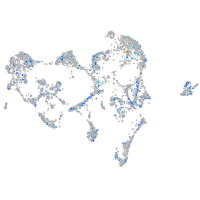
Correlated gene expression
Positive correlation
Negative correlation
Gene
r
Gene
r
psmb13a
0.160
and2
-0.077
mhc1zca
0.130
col1a1a
-0.075
LOC108183785
0.127
and1
-0.064
jhy
0.119
CABZ01074130.1
-0.059
LOC110440005
0.117
vcanb
-0.054
srpx2
0.113
qdpra
-0.053
ccdc36
0.111
si:ch211-76l23.4
-0.046
slc1a6
0.109
fah
-0.043
LOC101885837
0.104
LOC103909969
-0.043
LOC562770
0.103
matn4
-0.043
megf6a
0.103
col28a2a
-0.043
LOC101884710
0.102
glud1b
-0.042
si:ch211-1o7.3
0.101
si:ch73-86n18.1
-0.041
tmeff1b
0.101
rbp4
-0.040
si:dkey-108k21.19
0.101
itgav
-0.038
dkk1a
0.098
pah
-0.038
zgc:171686
0.097
and4
-0.038
pwwp2a
0.097
col7a1l
-0.037
si:dkey-126h10.1
0.097
fbln1
-0.037
sem1
0.094
si:ch211-14k19.8
-0.036
pimr65
0.093
mpdu1a
-0.036
h3f3d
0.093
postnb
-0.036
arxa
0.093
slc16a10
-0.036
dlx4b
0.092
and3
-0.035
LOC100334934
0.091
wu:fa03e10
-0.035
prdm1a
0.090
gstz1
-0.035
bmp6
0.090
daam1b
-0.034
isl2a
0.090
paplna
-0.034
col14a1a
0.090
XLOC-013086
-0.033
CMKLR1 (1 of many)
0.090
krtt1c19e
-0.033
si:ch211-194g2.4
0.089
klf15
-0.032
apoc1
0.089
rflnb
-0.032
si:ch211-267e7.3
0.089
CABZ01044154.1
-0.032
ncbp2
0.089
ptx3a
-0.032
nfyba
0.089
cavin1b
-0.031