Daniocell
met (blastomeres)
"MET proto-oncogene, receptor tyrosine kinase"
ZFIN
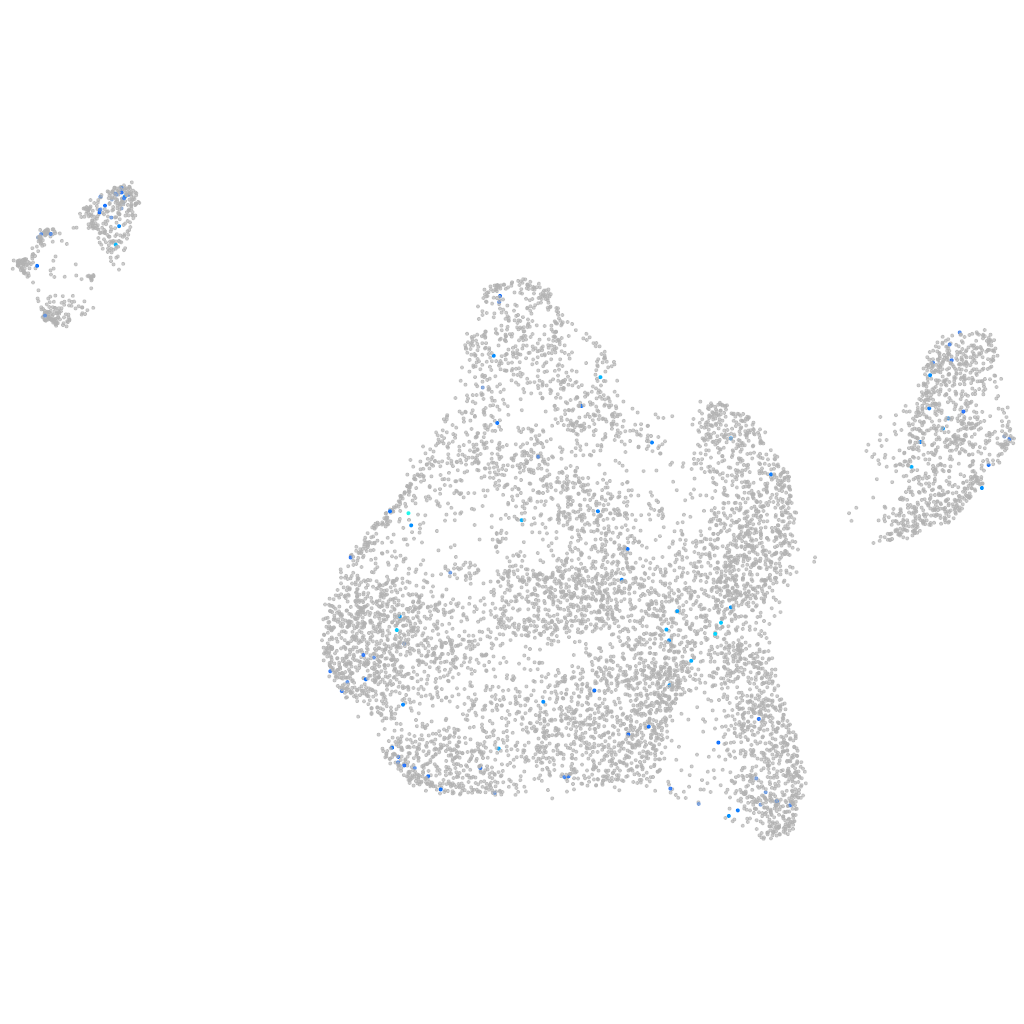
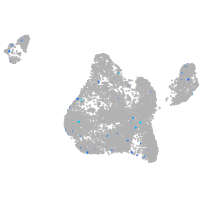
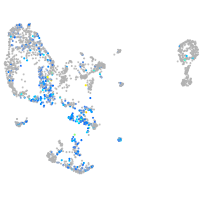
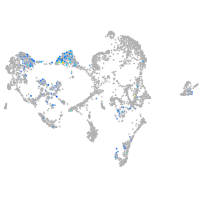
Gene expression UMAP
Display:
Expression
Stage
Other cell groups
all cells
blastomeres
PGCs
endoderm
axial mesoderm
muscle
mural cells /
non-skeletal muscle
mesenchyme
hematopoietic /
vasculature
pronephros
neural
spinal cord / glia
eye
taste / olfactory
otic / lateral line
epidermis
periderm
fin
ionocytes / mucous
pigment cells
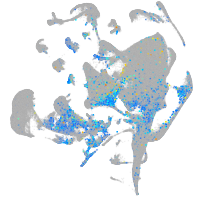
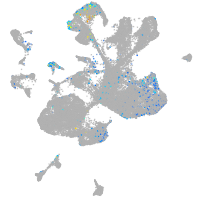
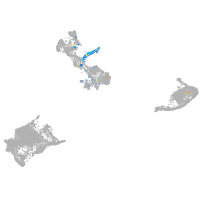
Expression by stage/cluster
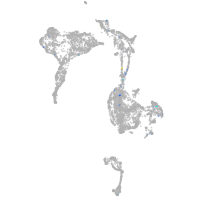
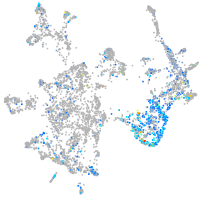
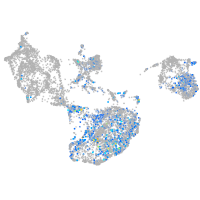
Correlated gene expression
Positive correlation
Negative correlation
Gene
r
Gene
r
si:ch73-281i18.7
0.148
rps5
-0.059
XLOC-040515
0.147
hnrnpa0b
-0.056
si:ch211-111e20.1
0.144
rpl10
-0.051
exoc3l2a
0.125
dynll1
-0.050
svopb
0.125
eef1a1l1
-0.049
tradv10.0.5
0.121
si:ch73-1a9.3
-0.047
AL929586.1
0.115
hmgb2a
-0.047
baalca
0.108
rpl7
-0.046
LOC559637
0.103
si:ch211-222l21.1
-0.044
aste1a
0.103
hmgn6
-0.044
BX649300.2
0.102
rps2
-0.043
LOC101885990
0.102
rpl13a
-0.043
CR392012.2
0.101
hspb1
-0.042
eva1a
0.101
marcksl1b
-0.042
plekhd1
0.099
rps11
-0.042
svopa
0.098
LEPROTL1
-0.040
pcdh2ab2
0.098
aldob
-0.038
vcanb
0.097
tra2a
-0.038
pimr141
0.096
hmga1a
-0.038
CU633479.5
0.095
srsf11
-0.036
METTL21C
0.095
rps7
-0.036
RF00611
0.095
COX3
-0.036
XLOC-029998
0.094
rplp1
-0.036
LOC101887036
0.094
rhoab
-0.036
dok7
0.093
rpsa
-0.035
apobec2a
0.092
anp32b
-0.035
XLOC-001294
0.092
si:dkey-151g10.6
-0.035
hipk1a
0.092
rasl11b
-0.035
LOC101886933
0.091
rps6
-0.035
acadsb
0.091
ptmab
-0.034
gda
0.090
srsf5a
-0.034
ugt2a3
0.089
rps15
-0.034
CABZ01057488.1
0.089
hspa8
-0.034
CR381544.2
0.087
polr3gla
-0.034
si:dkey-163f12.6
0.087
rps8a
-0.033