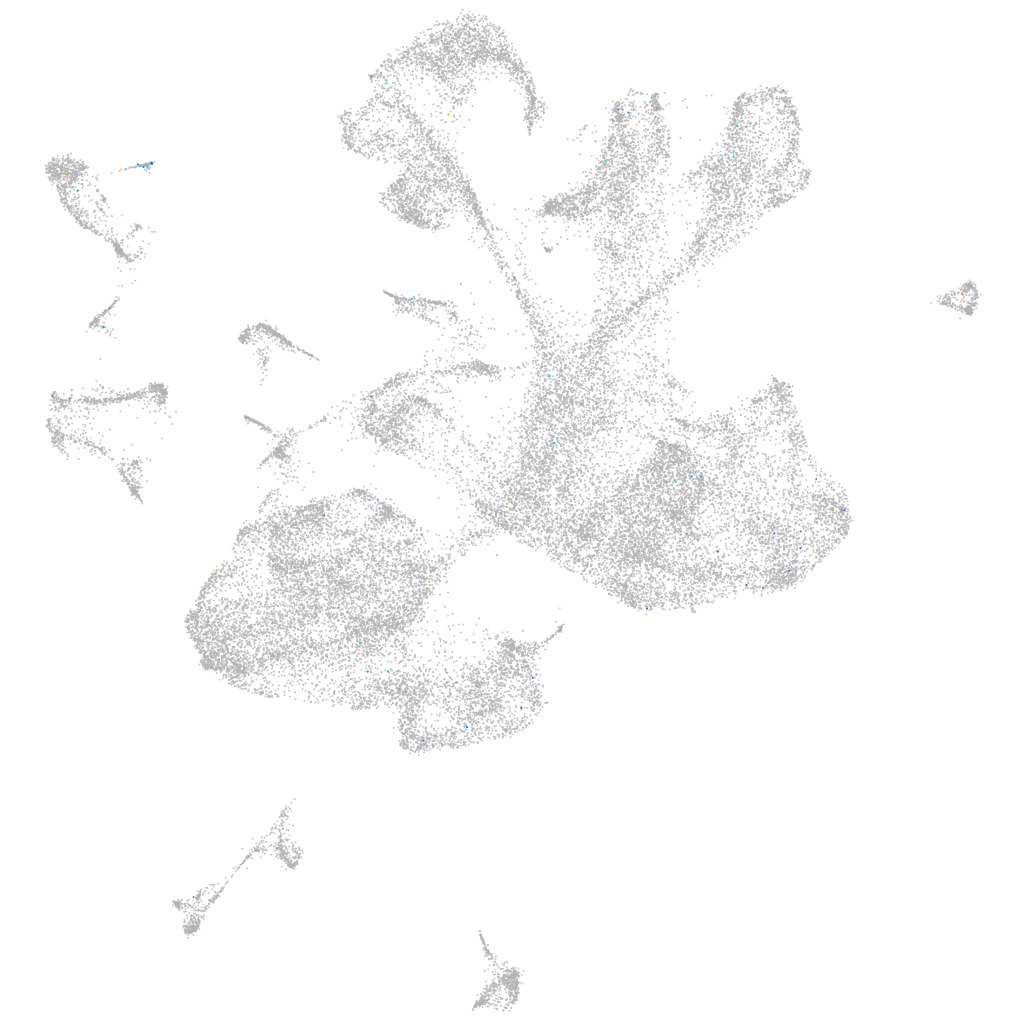
Daniocell
march1 (glial cells / spinal cord)
membrane-associated ring finger (C3HC4) 1
ZFIN
Gene expression UMAP
Display:
Expression
Stage
Other cell groups
all cells
blastomeres
PGCs
endoderm
axial mesoderm
muscle
mural cells /
non-skeletal muscle
mesenchyme
hematopoietic /
vasculature
pronephros
neural
spinal cord / glia
eye
taste / olfactory
otic / lateral line
epidermis
periderm
fin
ionocytes / mucous
pigment cells
Expression by stage/cluster
Correlated gene expression
Positive correlation
Negative correlation
Gene
r
Gene
r
gip
0.176
rpl18
-0.032
LOC103909492
0.146
rps12
-0.025
syt1b
0.139
si:ch73-1a9.3
-0.024
LO018315.7
0.133
rps23
-0.023
LOC103909566
0.132
rps20
-0.022
XLOC-026497
0.131
hmgn6
-0.020
XLOC-043690
0.130
rplp0
-0.020
si:cabz01030277.1
0.129
rps5
-0.020
BX571762.2
0.122
rpl17
-0.019
LOC100149700
0.118
rps10
-0.019
si:dkey-43k4.5
0.115
h3f3c
-0.018
LO018238.1
0.113
btf3
-0.018
emb
0.112
cirbpb
-0.018
atp1b1b
0.111
rps26
-0.018
sst6
0.109
rps27a
-0.018
six1b
0.102
hnrnpa0b
-0.018
nefla
0.099
rpl13
-0.018
LOC103911301
0.098
rps3a
-0.018
asb16
0.097
rps25
-0.017
si:dkeyp-77c4.5
0.095
rpl37
-0.017
igl3v1
0.089
rps15a
-0.017
XLOC-015432
0.087
nova2
-0.017
si:dkey-27m7.4
0.087
rpl19
-0.017
gorasp1b
0.084
si:ch73-281n10.2
-0.016
dkk3a
0.083
rpl35
-0.016
si:dkeyp-69c1.7
0.082
rpl39
-0.016
XLOC-038060
0.080
tpt1
-0.016
scn4bb
0.079
lsm6
-0.015
LO017877.1
0.079
rpl28
-0.015
TMEM196 (1 of many)
0.079
naca
-0.015
kcnk1a
0.078
rps7
-0.015
LOC101884422
0.078
marcksl1a
-0.015
zgc:65851
0.078
wu:fb55g09
-0.015
sst1.2
0.078
rps27.1
-0.015
plcd4a
0.077
eif3f
-0.015