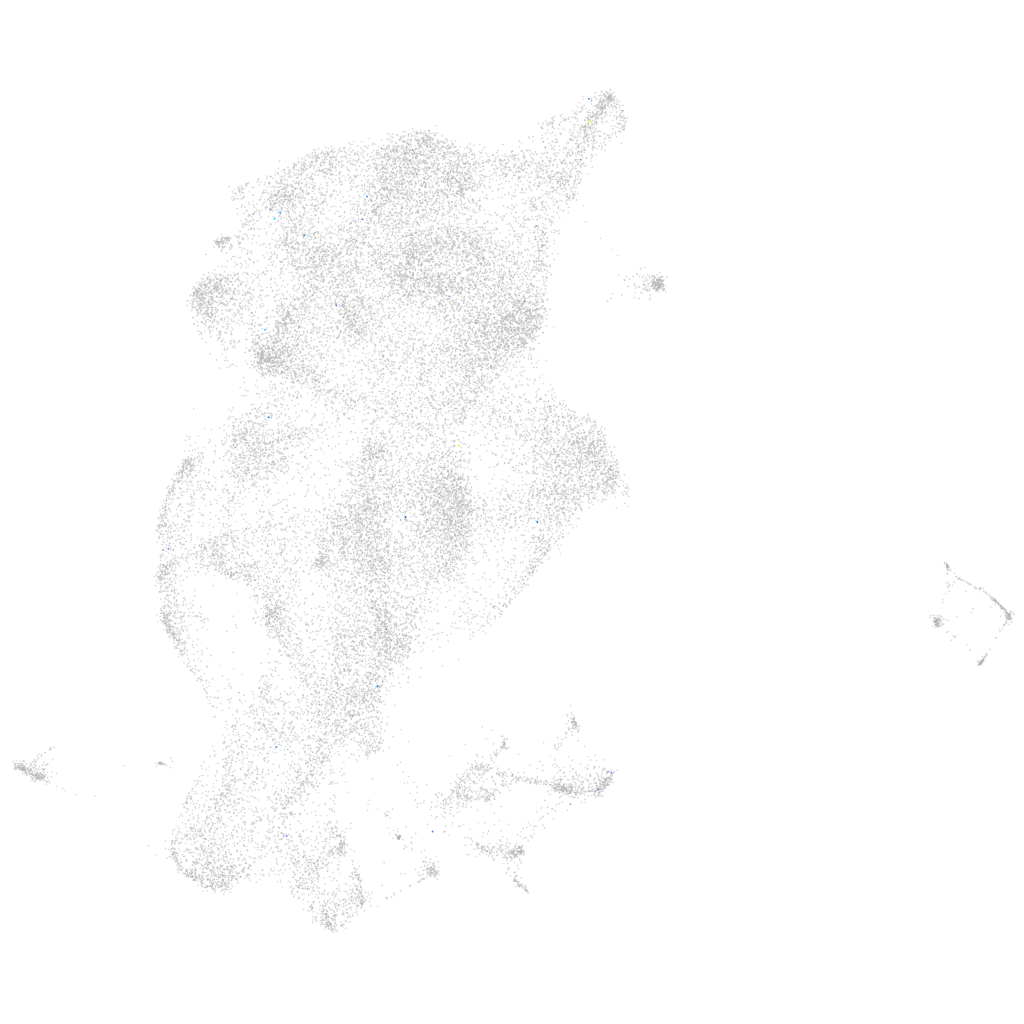
Daniocell
march1 (periderm)
membrane-associated ring finger (C3HC4) 1
ZFIN
Gene expression UMAP
Display:
Expression
Stage
Other cell groups
all cells
blastomeres
PGCs
endoderm
axial mesoderm
muscle
mural cells /
non-skeletal muscle
mesenchyme
hematopoietic /
vasculature
pronephros
neural
spinal cord / glia
eye
taste / olfactory
otic / lateral line
epidermis
periderm
fin
ionocytes / mucous
pigment cells
Expression by stage/cluster
Correlated gene expression
Positive correlation
Negative correlation
Gene
r
Gene
r
LOC101882378
0.431
si:dkeyp-86h10.3
-0.015
si:ch211-1f22.2
0.277
hdlbpa
-0.014
zgc:171844
0.265
ponzr3
-0.013
LOC101885478
0.219
ponzr4
-0.012
zmp:0000001048
0.218
casp3b
-0.012
pxdc1b
0.200
gabarapa
-0.012
cnga1a
0.172
zgc:193505
-0.012
LOC108179274
0.163
xbp1
-0.012
ACVR1C
0.154
nccrp1
-0.011
LOC103911233
0.144
uqcc1
-0.011
abcg4a
0.140
map1lc3a
-0.011
LOC103908995
0.137
mgst2
-0.011
zgc:165583
0.137
tnks1bp1
-0.011
ftr63
0.132
tcima
-0.010
si:ch73-256j6.6
0.124
psmd3
-0.010
kcnc2
0.116
arhgef16
-0.010
XLOC-042514
0.107
anxa1c
-0.010
rnf213b
0.104
cap1
-0.010
CT737190.1
0.102
pnkp
-0.010
LOC100537702
0.101
capgb
-0.010
BX005083.1
0.100
abracl
-0.010
cacng8a
0.100
crema
-0.010
slc22a7b.2
0.099
cbr1l
-0.010
atp8b5a
0.099
zgc:158263
-0.010
baiap3
0.099
terfa
-0.010
sgtb
0.099
ric8b
-0.010
si:dkey-7e14.3
0.098
aldh9a1a.1
-0.010
pcdh15b
0.095
myl12.1
-0.010
elovl5
0.094
pmaip1
-0.009
myot
0.092
svopl
-0.009
stxbp5l
0.091
alas1
-0.009
BX119915.3
0.090
si:dkey-112a7.4
-0.009
si:ch211-223k15.1
0.087
htatip2
-0.009
gata4
0.086
bicdl2
-0.009
rom1b
0.085
si:dkey-9l20.3
-0.009