Daniocell
map4k3b (taste / olfactory)
mitogen-activated protein kinase kinase kinase kinase 3b
ZFIN
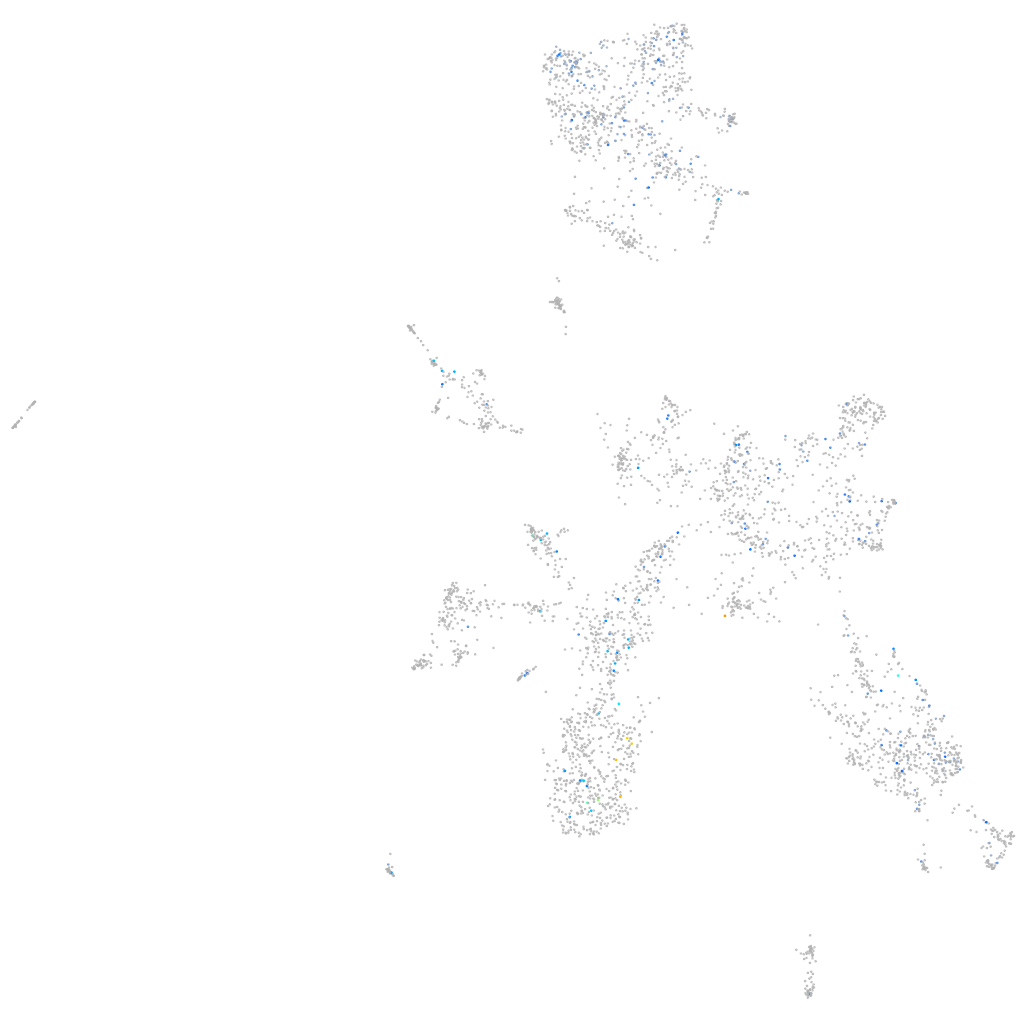
Gene expression UMAP
Display:
Expression
Stage
Other cell groups
all cells
blastomeres
PGCs
endoderm
axial mesoderm
muscle
mural cells /
non-skeletal muscle
mesenchyme
hematopoietic /
vasculature
pronephros
neural
spinal cord / glia
eye
taste / olfactory
otic / lateral line
epidermis
periderm
fin
ionocytes / mucous
pigment cells
Expression by stage/cluster
Correlated gene expression
Positive correlation
Negative correlation
Gene
r
Gene
r
zgc:194392
0.242
h3f3d
-0.063
LOC101885283
0.230
rpl36a
-0.062
CU179656.2
0.213
cox4i1
-0.059
XLOC-040355
0.206
uba52
-0.057
LOC103909323
0.200
rpl18a
-0.056
spi1b
0.194
hspa8
-0.054
lpar6b
0.182
rps5
-0.053
LOC110439623
0.178
spcs2
-0.052
si:cabz01069015.1
0.173
sumo3a
-0.049
cftr
0.166
mdkb
-0.047
CR847844.1
0.164
rplp2
-0.046
LOC110437837
0.157
dusp14
-0.045
LOC100000752
0.155
nanos1
-0.045
znf987
0.155
mylpfa
-0.043
sv2ba
0.146
vdac1
-0.043
si:ch73-281i18.3
0.145
rpl17
-0.042
itgb7
0.141
hmgn7
-0.042
mespaa
0.139
si:dkey-151g10.6
-0.041
LOC110439519
0.139
rps16
-0.041
bcl6b
0.136
cox7c
-0.040
LOC101883516
0.131
hmgb1b
-0.040
rab25b
0.124
vdac3
-0.040
XLOC-006197
0.124
rbm8a
-0.039
LOC103910428
0.123
ndufb2
-0.039
cdx4
0.122
mmgt1
-0.039
disp2
0.120
nme2b.1
-0.039
tbr1a
0.119
olfm1b
-0.039
XLOC-043912
0.119
ywhabl
-0.039
LOC108185170
0.119
rps4x
-0.038
LOC110440142
0.118
si:ch211-208k15.1
-0.038
LOC110439359
0.118
rps8a
-0.038
opn7c
0.117
s100z
-0.038
TMCC1
0.117
ptmab
-0.038
FP016208.1
0.114
cdk8
-0.038
znf687a
0.113
selenou1a
-0.038