Daniocell
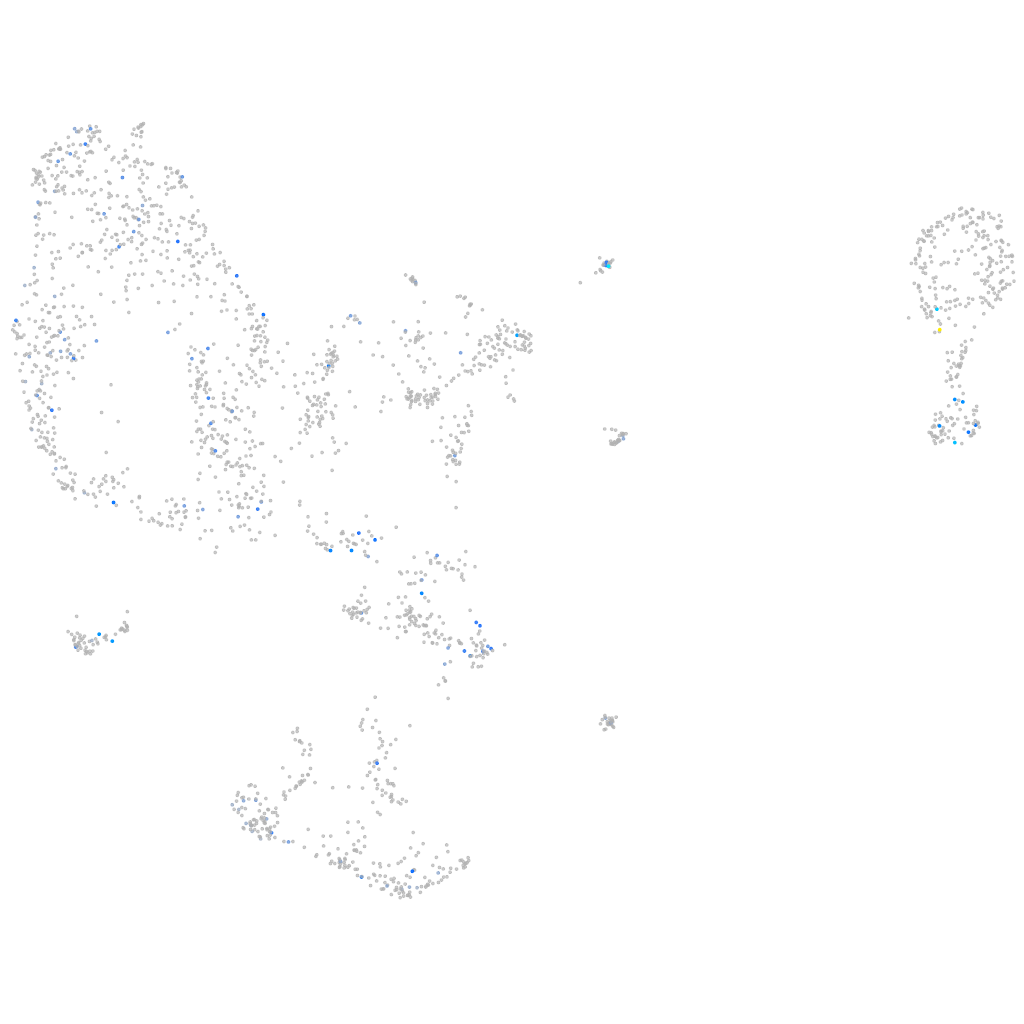
map4k3b (pronephros)
mitogen-activated protein kinase kinase kinase kinase 3b
ZFIN
Gene expression UMAP
Display:
Expression
Stage
Other cell groups
all cells
blastomeres
PGCs
endoderm
axial mesoderm
muscle
mural cells /
non-skeletal muscle
mesenchyme
hematopoietic /
vasculature
pronephros
neural
spinal cord / glia
eye
taste / olfactory
otic / lateral line
epidermis
periderm
fin
ionocytes / mucous
pigment cells
Expression by stage/cluster
Correlated gene expression
Positive correlation
Negative correlation
Gene
r
Gene
r
AL935117.1
0.271
si:ch211-162e15.3
-0.056
aifm3
0.255
cox7c
-0.054
BX465848.1
0.255
atp5mf
-0.051
LOC100537404
0.255
si:ch211-139a5.9
-0.050
zfyve9b
0.226
aldob
-0.048
triobpa
0.218
itm2cb
-0.047
slc8a4b
0.217
zic2b
-0.046
LOC569262
0.216
atp5pf
-0.046
LOC101882317
0.213
atp5l
-0.046
vwa5b2
0.211
atp5mc1
-0.045
si:ch73-208g10.1
0.205
cxcl12a
-0.045
rab3da
0.204
ndufs4
-0.044
BX649300.3
0.199
slc4a2a
-0.043
XLOC-042774
0.199
vox
-0.043
snx1b
0.196
ndufb6
-0.042
fev
0.196
tbx16
-0.041
frzb
0.195
tpma
-0.041
CR848791.2
0.189
pam16
-0.040
sema3bl
0.182
pabpc1b
-0.040
shroom4
0.179
cdx1a
-0.040
GABRR1 (1 of many)
0.178
grhprb
-0.040
si:rp71-45k5.2
0.176
uqcrq
-0.039
XLOC-023138
0.176
dab2
-0.039
mast1a
0.174
rnd1b
-0.039
wasa
0.171
ppp1r3b
-0.039
si:dkey-202e17.1
0.170
acox3
-0.039
eogt
0.167
hoxa9b
-0.038
cul5b
0.167
mfap1
-0.038
gga3b
0.166
gstr
-0.038
si:dkey-19a16.12
0.166
aifm1
-0.038
stc1l
0.166
zgc:112102
-0.038
pcsk2
0.163
syncripl
-0.038
prph2b
0.161
slc46a1
-0.037
si:ch211-163l21.8
0.161
dpp3
-0.037
si:ch211-168d23.3
0.161
BX957362.1
-0.037