Daniocell
map4k3b (blastomeres)
mitogen-activated protein kinase kinase kinase kinase 3b
ZFIN
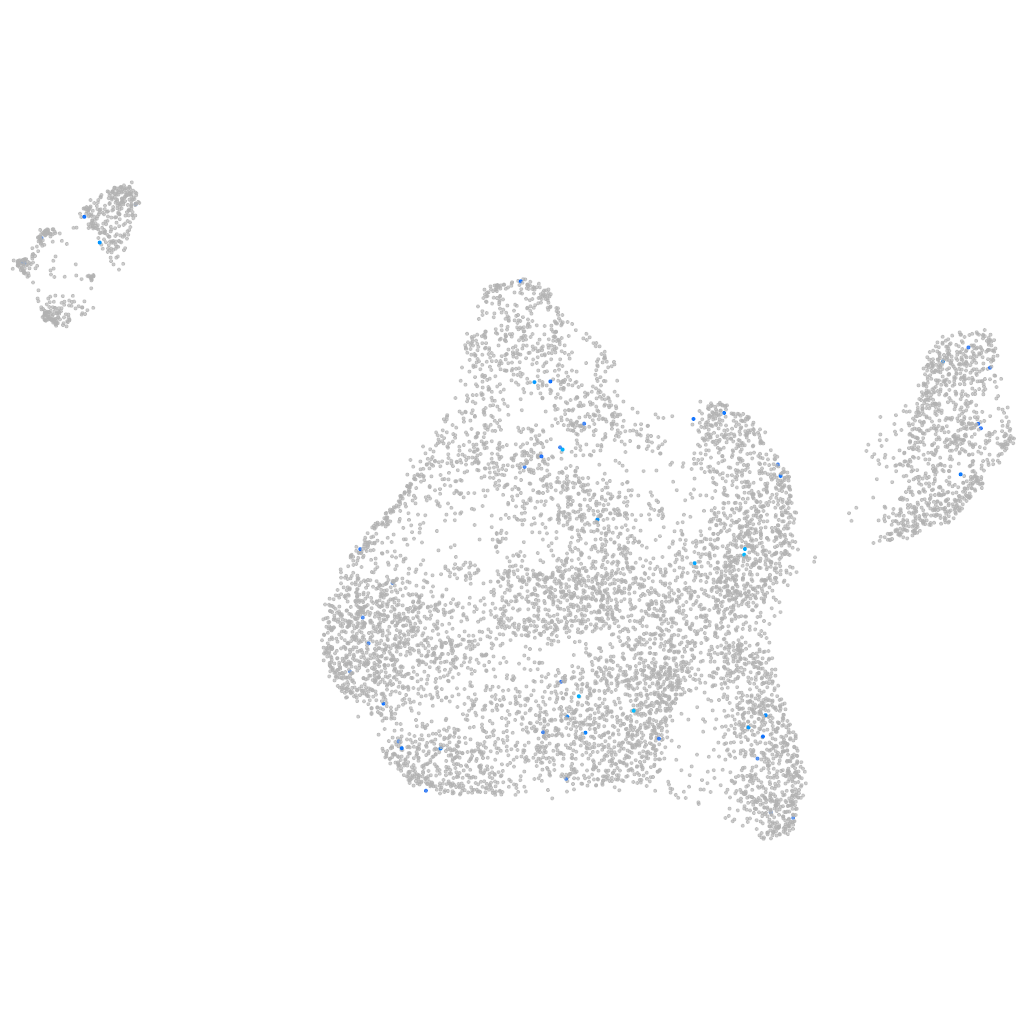
Gene expression UMAP
Display:
Expression
Stage
Other cell groups
all cells
blastomeres
PGCs
endoderm
axial mesoderm
muscle
mural cells /
non-skeletal muscle
mesenchyme
hematopoietic /
vasculature
pronephros
neural
spinal cord / glia
eye
taste / olfactory
otic / lateral line
epidermis
periderm
fin
ionocytes / mucous
pigment cells
Expression by stage/cluster
Correlated gene expression
Positive correlation
Negative correlation
Gene
r
Gene
r
XLOC-038929
0.212
hmgb2b
-0.027
LOC103908784
0.188
selenow1
-0.027
LO018605.2
0.185
rpl8
-0.027
ccl32b.3
0.163
mt-atp6
-0.025
CABZ01040998.1
0.159
purbb
-0.025
slc22a2
0.155
pdcd11
-0.025
ackr4a
0.134
polr2c
-0.024
si:ch211-146m13.3
0.133
rbbp4
-0.024
ACKR2
0.131
hnrnpabb
-0.024
nxnl1
0.131
rbm8a
-0.024
btr29
0.125
cstf2
-0.023
si:ch1073-376c22.1
0.123
cst3
-0.023
pgr
0.120
med4
-0.023
si:dkey-56m15.5
0.119
cct5
-0.023
CABZ01112049.1
0.118
ngdn
-0.023
bnip1a
0.113
cox4i1
-0.022
RF00156
0.113
arhgef7a
-0.022
CU694255.2
0.112
setdb1b
-0.022
si:ch211-197e7.1
0.111
astn1
-0.022
CABZ01077121.1
0.110
taf13
-0.022
XLOC-016856
0.108
txn2
-0.022
enpep
0.107
jpt2
-0.022
si:ch1073-214b20.2
0.106
hnrnpul1
-0.022
XLOC-025024
0.106
nosip
-0.022
rhbdf1b
0.103
prcc
-0.022
XLOC-007169
0.101
tcea1
-0.021
zgc:162989
0.101
h3f3d
-0.021
lrrc3ca
0.098
pigx
-0.021
si:cabz01069013.4
0.097
nkain1
-0.021
alp3
0.096
eif2s3
-0.021
si:dkey-13m1.5
0.095
si:ch211-276i12.11
-0.021
cpt1b
0.095
akr1a1b
-0.021
adamts8a
0.095
alkbh8
-0.021
XLOC-018654
0.094
cdk1
-0.021
hcn4
0.094
mrpl46
-0.021