Daniocell
map3k20 (glial cells / spinal cord)
mitogen-activated protein kinase kinase kinase 20 [Source:ZFIN;Acc:ZDB-GENE-070928-11]
ZFIN
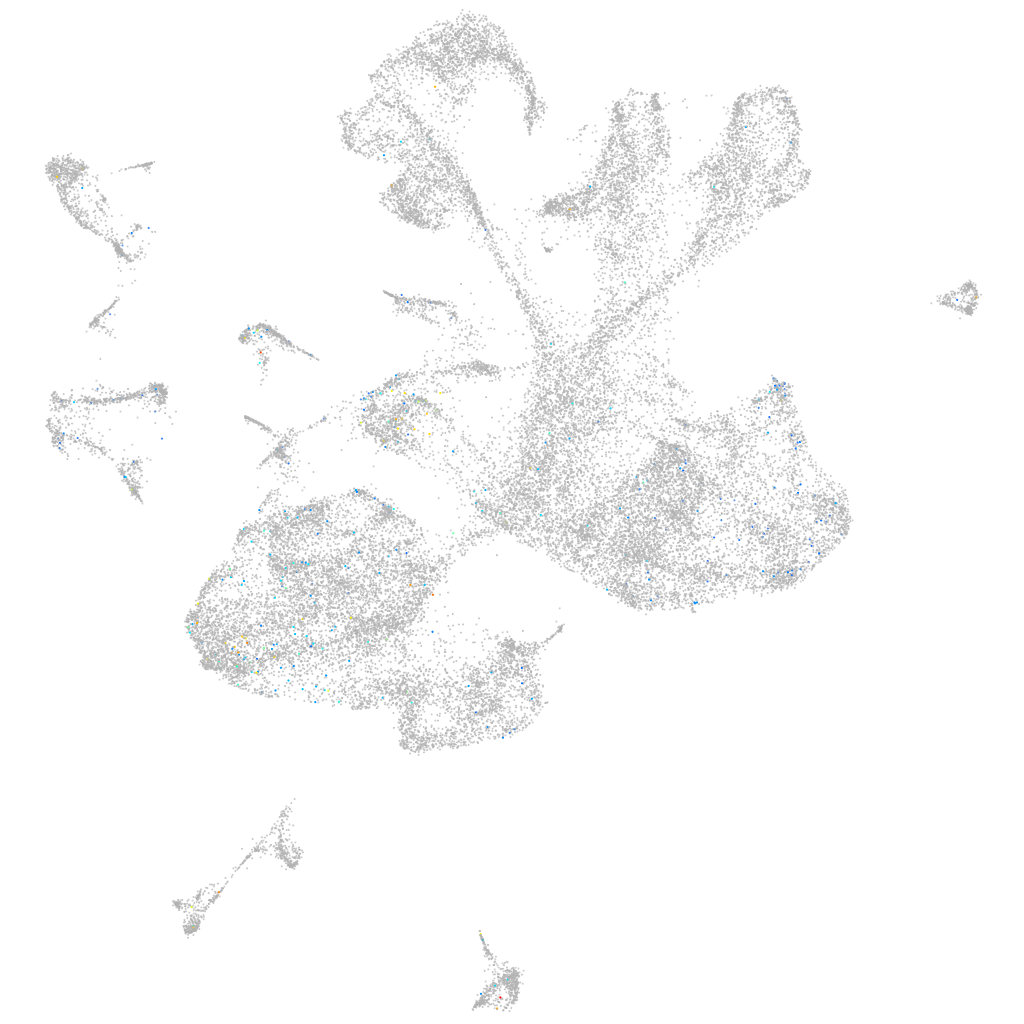
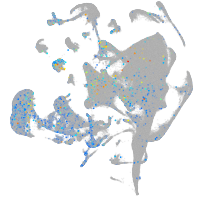
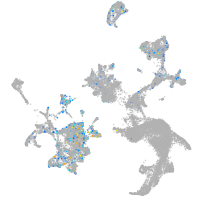
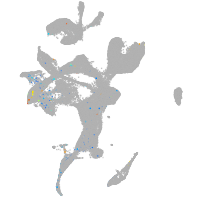
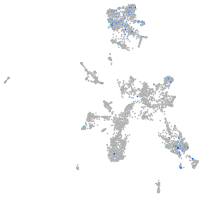
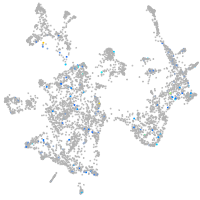
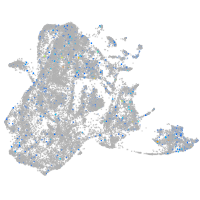
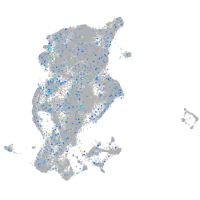
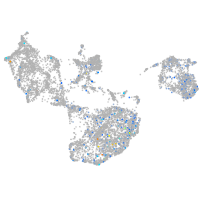
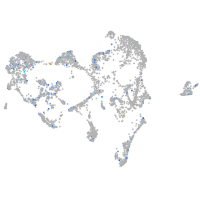
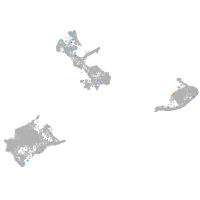
Gene expression UMAP
Display:
Expression
Stage
Other cell groups
all cells
blastomeres
PGCs
endoderm
axial mesoderm
muscle
mural cells /
non-skeletal muscle
mesenchyme
hematopoietic /
vasculature
pronephros
neural
spinal cord / glia
eye
taste / olfactory
otic / lateral line
epidermis
periderm
fin
ionocytes / mucous
pigment cells
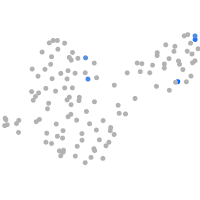
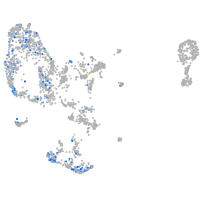
Expression by stage/cluster
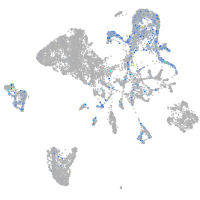
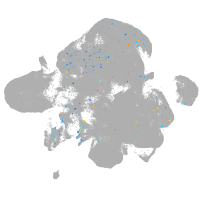
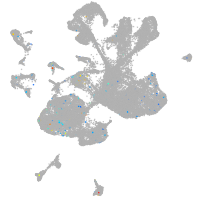
Correlated gene expression
Positive correlation
Negative correlation
Gene
r
Gene
r
hepacama
0.082
ptmab
-0.059
bco2b
0.079
si:ch211-222l21.1
-0.055
slc1a3b
0.077
cirbpb
-0.053
asb12b
0.072
h3f3d
-0.051
zgc:171452
0.070
hnrnpa0l
-0.049
cx43
0.070
fabp3
-0.048
si:ch1073-13h15.3
0.070
khdrbs1a
-0.048
si:ch211-198m17.1
0.070
hsp90ab1
-0.047
LOC100535869
0.069
tubb2b
-0.047
CU855694.1
0.068
elavl3
-0.046
ptn
0.067
cirbpa
-0.046
pald1b
0.067
hnrnpaba
-0.046
si:dkey-183k8.2
0.067
hmgn6
-0.045
LOC101882128
0.065
hmga1a
-0.043
gpr37l1b
0.065
faua
-0.043
ppap2d
0.064
rps5
-0.043
LOC108190589
0.064
marcksb
-0.042
flvcr2a
0.063
rpl21
-0.042
XLOC-024706
0.062
ilf2
-0.042
si:ch211-66e2.5
0.062
rps15a
-0.041
slc4a4a
0.062
h3f3a
-0.041
tuft1a
0.062
h2afvb
-0.041
cldn7a
0.062
rps25
-0.040
pbxip1b
0.061
hmgn2
-0.039
LOC103910738
0.060
hmgb1b
-0.039
si:dkey-40g16.5
0.060
myt1b
-0.039
slc3a2a
0.059
rps20
-0.038
atp1a1b
0.059
tubb5
-0.038
qki2
0.059
rps15
-0.037
sept8b
0.058
si:ch211-288g17.3
-0.036
cd63
0.057
tmsb
-0.036
slc1a2b
0.057
si:ch73-1a9.3
-0.036
LOC108190067
0.057
hnrnpa0b
-0.036
micall2a
0.057
rpl13a
-0.036
il2rb
0.056
rps21
-0.036